
Blog

Every December, the financial media resurrects the same narrative: the Santa Claus rally is coming. Portfolio managers brace for year-end momentum, retail investors pile into equities, and analysts debate whether seasonal patterns remain relevant in algorithmic, global markets.
The question isn't whether seasonal patterns exist—they demonstrably do. The question is whether they're exploitable, what drives them, and how advisors should integrate this knowledge into disciplined portfolio management.
The Statistical Reality of Year-End Strength
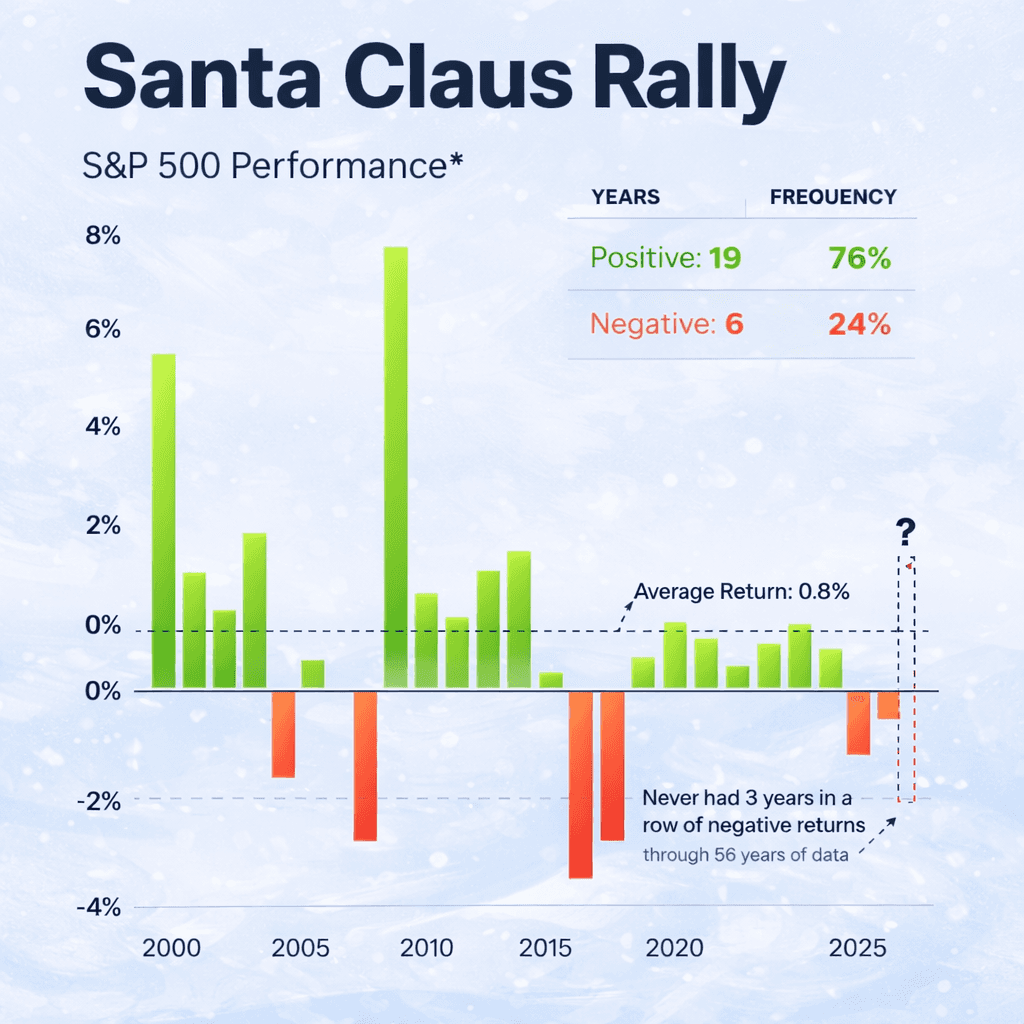
The Santa Claus rally, as defined by Yale Hirsch's Stock Trader's Almanac, refers specifically to the final five trading days of December plus the first two of January. Over this seven-day window, the S&P 500 has gained an average of 1.3% since 1969, with positive returns occurring approximately 78% of the time.
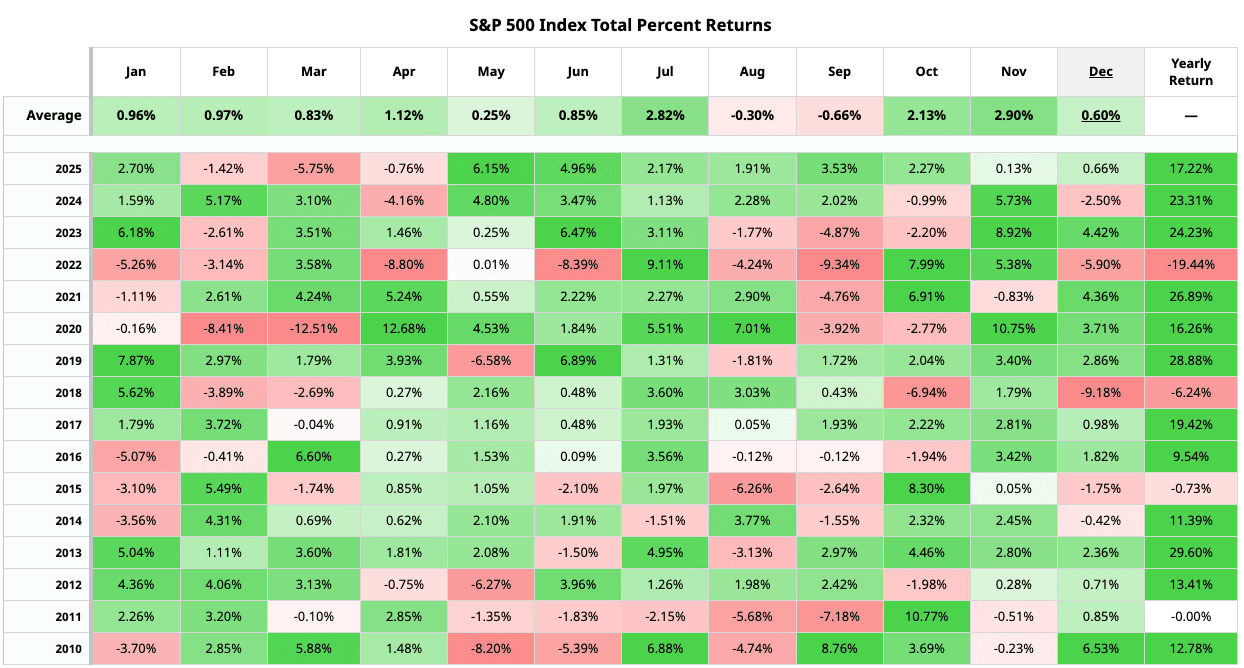
But the phenomenon extends beyond this narrow window. According to data from LPL Financial, December ranks as the second-best month historically for the S&P 500, with average gains of 1.6% since 1950. The broader "year-end rally" spanning November through January has produced positive returns in 74% of years since 1928, with an average three-month gain exceeding 4%.
This isn't statistical noise—it's a persistent pattern demanding explanation.
Why Year-End Patterns Persist
Multiple structural and behavioral factors contribute to seasonal strength, and understanding these mechanisms helps distinguish reliable signals from speculative folklore.
Tax-Loss Harvesting Completion: Throughout November and early December, investors sell losing positions to offset capital gains. This creates artificial selling pressure that reverses as the calendar year closes. IRS data consistently shows concentrated December selling in taxable accounts, followed by January reinvestment—the "January effect."
Bonus and Retirement Contributions: Year-end bonuses, which CNBC reports averaged $7,800 in the financial sector for 2024, flow into markets in December and January. Additionally, many investors maximize 401(k) contributions by year-end, creating systematic buying pressure. According to Vanguard's "How America Saves" report, contribution rates spike in Q4 as employees front-load deferrals.
Window Dressing: Portfolio managers underweight poorly performing stocks heading into year-end reporting, then rebalance in January. While academic research questions whether this materially moves markets, it contributes to momentum in recent winners.
Reduced Volume and Volatility: Trading volume typically declines 15-20% in late December, as institutional traders take vacation. Lower liquidity can amplify upward movements, particularly in the final week when short covering accelerates.
Optimism Bias: Behavioral finance identifies the "fresh start effect"—psychological tendency toward optimism as new periods begin. This manifests in increased risk-taking as investors position for the coming year with renewed confidence.
The 2025 Rally: Different This Time?
The 2024-2025 year-end period exhibited classic seasonal patterns but with unique contemporary drivers that warrant examination.
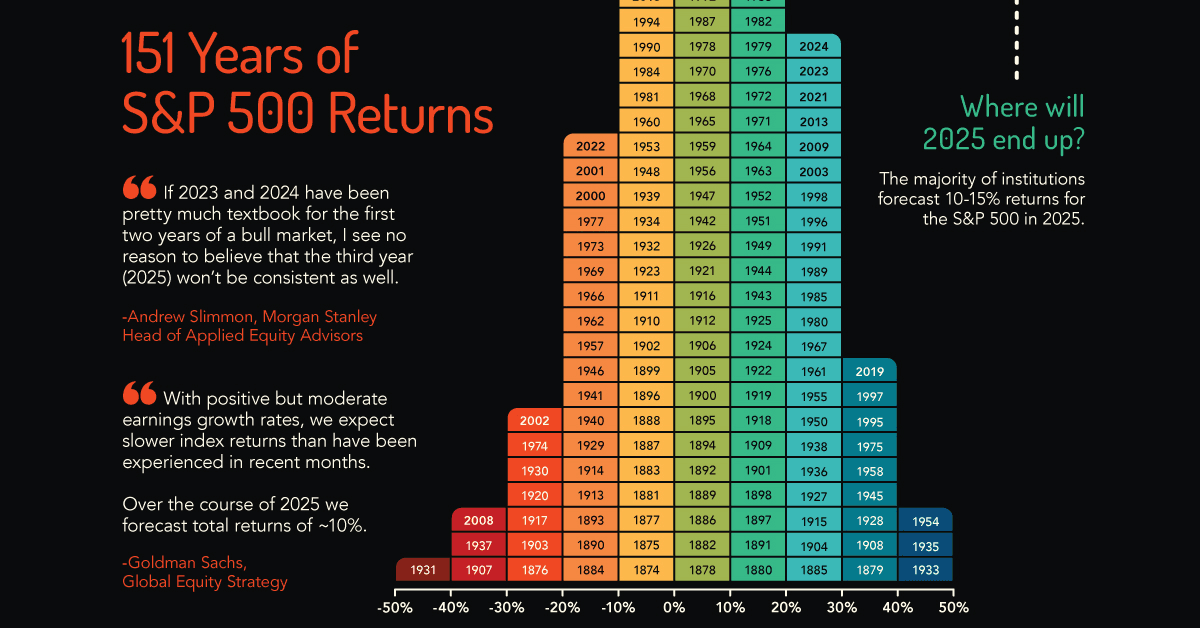
Through December 20, 2025, the S&P 500 had gained approximately 26% year-to-date, continuing momentum despite elevated valuations. The November-December rally specifically added over 4%, supported by several convergent factors:
Monetary Policy Clarity: The Fed's December 2024 decision to cut rates by 25 basis points while projecting fewer cuts in 2025 paradoxically boosted markets. Clarity around policy trajectory reduced uncertainty, even as the path proved less dovish than earlier anticipated.
Earnings Resilience: Q3 2024 earnings exceeded expectations, with S&P 500 companies beating estimates by 8.1%, according to FactSet. Forward guidance suggested continued growth, particularly in technology and industrial sectors.
AI Investment Cycle: Unlike previous year-end rallies driven by broad market participation, 2024's momentum concentrated heavily in artificial intelligence infrastructure and adjacent sectors. Bloomberg Intelligence estimated AI-related spending would reach $154 billion in 2024, creating sustained demand for semiconductor and cloud computing equities.
Retail Participation: Democratized investing through zero-commission platforms amplified seasonal patterns. Charles Schwab reported record new account openings in Q4 2024, with retail investors demonstrating greater willingness to "buy the dip" than in previous cycles.
International Divergence
While U.S. markets exhibited textbook seasonal strength, international patterns diverged significantly in 2024-2025.
European equities struggled through year-end despite the ECB's easing, with the STOXX Europe 600 gaining just 6.8% for the full year. Political uncertainty in France and Germany, combined with anemic economic growth, overwhelmed seasonal tailwinds.
Emerging markets showed mixed results. China's CSI 300 rallied 16% in Q4 following stimulus announcements, demonstrating that policy surprises can override seasonal weakness. Meanwhile, Latin American markets faced headwinds from commodity price volatility and currency depreciation.
For globally diversified portfolios, these divergences highlight that seasonality operates differently across regions—U.S. tax calendar effects don't translate to markets without December year-ends.
The Contrarian Perspective: When Seasonality Fails
Seasonal patterns are probabilistic, not deterministic. Understanding failure modes prevents overreliance on historical tendencies.
The 2018 year-end serves as cautionary tale. Despite typical seasonal drivers, the S&P 500 plunged 9.2% in December 2018—the worst December since 1931. Fed hawkishness, trade war escalation, and recession fears overwhelmed seasonal support.
Similarly, December 2022 delivered flat returns despite rate hike fatigue, as investors remained skeptical of earnings resilience heading into 2023.
Academic research published in the Journal of Financial Economics suggests seasonal patterns have weakened as markets became more efficient and information dissemination accelerated. The "January effect" for small caps, once reliable, has essentially disappeared since 2000.
Practical Applications for Advisors
So how should advisors leverage—or dismiss—seasonal patterns in portfolio construction?
Rebalancing Timing: Tax-loss harvesting creates year-end dislocations that systematic rebalancing can exploit. Executing rebalances in late December or early January captures these inefficiencies, particularly in taxable accounts where individual investor behavior concentrates.
Options Strategies: Seasonal volatility compression in late December creates opportunities for option sellers. VIX levels typically decline 12-15% from Thanksgiving through year-end, making premium collection strategies more attractive—though 2024 proved exceptional with volatility remaining elevated.
Cash Deployment: For clients sitting on excess cash, January often provides better entry points than December as early-year volatility returns. While this contradicts "time in the market" principles, behavioral reality suggests staged deployment improves client satisfaction.
Communication Over Trading: Perhaps most importantly, seasonal patterns provide framework for client communication. Explaining why markets behave predictably during specific periods reduces anxiety and prevents reactionary decisions.
The Signal Versus Noise Problem
Seasonal patterns exist, but their explanatory power is limited. They account for perhaps 2-3% of annual returns—meaningful but insufficient for portfolio decisions.
The danger lies in mistaking correlation for causation or allowing seasonal expectations to override fundamental analysis. A portfolio positioned solely to capture Santa Claus rallies would underperform dramatically over full market cycles.
Modern advisors need infrastructure that accommodates nuanced strategies—systematic rebalancing that executes tax-efficiently, risk management that adapts to changing volatility regimes, and client reporting that contextualizes short-term movements within long-term plans.
Seasonality isn't myth, but it's not magic either. It's one variable among dozens that thoughtful advisors monitor, understand, and occasionally exploit—never at the expense of disciplined, evidence-based portfolio management that serves clients through all seasons.
Related


Get Started
Experience the full power of our SaaS platform with a risk-free trial. Join countless businesses who have already transformed their operations. No credit card required.

FAQs
How can this impact my business?
How long does an this take to implement?
Will we need to make changes in our teams?

Still have a question?
Get in touch with our team.

