
Blog

Internal vs. External Management in Closed-End Vehicles: What the Fee Model Really Costs Over a Full Cycle
When conducting due diligence on a closed-end fund or business development company, most analytical frameworks centre on the obvious variables. These typically include the headline yield, the discount or premium to NAV, the credit quality of the underlying portfolio, and the track record of distribution coverage. These are, of course, necessary inputs. But one structural variable that routinely gets treated as background noise is arguably the most consequential of all. This is the management structure.
The management structure is a compounding variable that silently shapes every other metric investors rely on, and its effects become increasingly difficult to ignore, the longer the investment horizon extends.
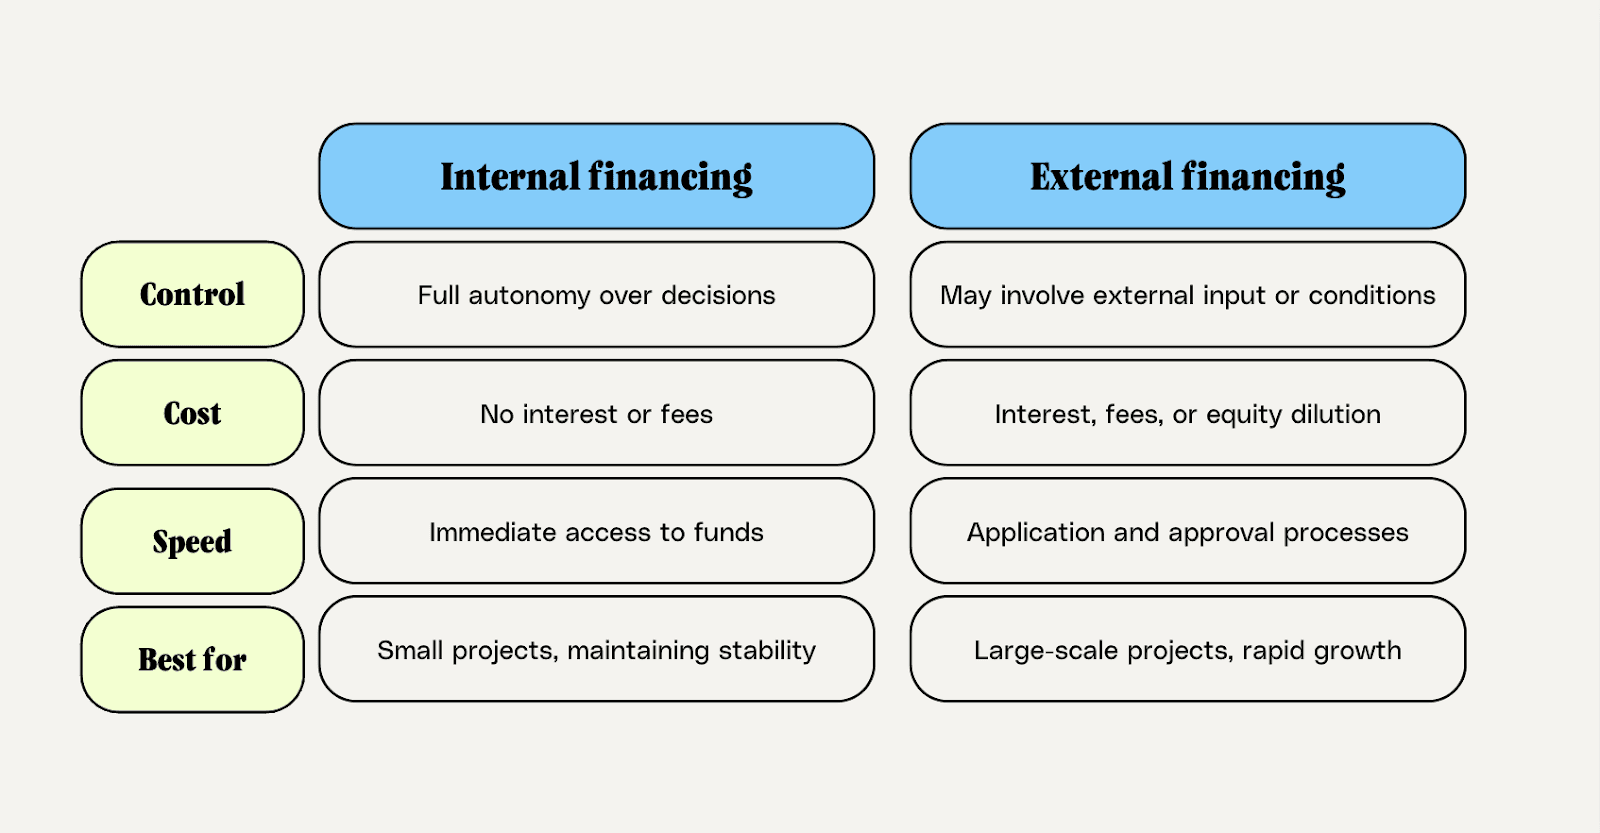
The landscape breaks cleanly into two models. The first of these is external management, which is the dominant structure. This places an independent sponsor firm in charge of running the vehicle in exchange for contractual fees. Internal management, a relative rarity in the closed-end universe, employs the management team directly within the fund.
On a single-year basis, the difference between the two can look trivial. But viewed across a full market cycle (through a credit tightening, a recovery, and the reinvestment environment that follows) it rarely ever is.
The question this piece attempts to answer is a specific one.
After properly accounting for fee drag, incentive design, and the structural conflicts inherent in the external model, which management structure is more likely to protect and compound investor capital over time?
Fee Drag, Incentive Misalignment, and the Hidden Cost of the External Model
So let’s start with the mechanics. A typical externally managed closed-end vehicle charges a base management fee in the range of 1.5% to 2% of assets, plus an incentive fee (which is commonly about 20% of returns) above a stated hurdle rate. This looks structurally familiar because it mirrors the hedge fund model. What is less frequently scrutinised, however, is the fee base itself.
The base fee is charged on gross assets, not net assets. This is a critical distinction. A fund running 1.0x debt-to-equity has roughly twice the gross asset base relative to its equity. In practice, this means a fund with a 1.5% stated management fee is effectively levying closer to 3% on equity, well before any incentive fees are calculated. The manager benefits from leverage; while the investor bears its cost and its risk.
Modelled over a ten-year horizon, the NAV-per-share gap between an internally and externally managed vehicle with otherwise identical portfolios is not minor.
According to one analysis, internally managed vehicles typically trade at a premium to NAV (historically around +1.7%), while externally managed vehicles often trade at a significant discount (averaging -17.1%). This gap reflects investor preferences for transparency, aligned incentives, and lower overall cost structures.
Assuming a gross return of 10% annually, a 3% effective fee on equity compounds into a meaningful shortfall relative to a vehicle where operating expenses scale at a slower rate as the asset base grows. Internal management creates economies of scale that external structures, by design, do not share with shareholders.
The incentive misalignment problem, however, may be more consequential than the fee line itself. External managers have a structural interest in growing assets under management, because the base fee scales with the asset base. This creates a quiet but persistent pressure:
deploy capital quickly,
accept tighter spreads to win deal flow, and
maintain surface-level income coverage even when the credit environment does not justify it.
The manager's economics improve with scale; the shareholder's risk-adjusted return does not necessarily follow. Ultimately, this could lead to an erosion of client trust.
There is also the question of pipeline ownership. Externally managed vehicles are frequently affiliated with larger sponsor platforms that originate deal flow across multiple funds. This creates a conflict that is difficult to resolve through disclosure alone: is the deal being allocated to this vehicle because it is the best fit for this investor base, or because the sponsor's credit committee has determined it is appropriate inventory for a fee-generating sleeve? Internally managed vehicles, where the team has no external sponsor relationship to manage, are structurally insulated from this problem.
Finally, there is the alignment question at the ownership level. Internal management typically means the team holds meaningful equity in the vehicle itself — not in a separate management company that captures economics regardless of fund performance. When a management team's wealth is directly tied to NAV per share rather than to AUM, the incentive calculus changes in ways that show up in portfolio conservatism, leverage discipline, and dividend policy over time.
What This Means for Manager Selection and Portfolio Construction
For advisors constructing income-oriented portfolios, three practical adjustments follow from this analysis.
First, reframe the fee screen. The standard practice of comparing headline management fee rates across peer vehicles obscures the more important number: the effective fee on equity at the fund's current leverage ratio. Calculate this directly — take the stated base fee, multiply by the gross asset base, and divide by net assets. Then stress-test it at one leverage turn higher and one lower. This single adjustment frequently reorders a peer comparison in ways that the headline fee comparison does not.
Second, scrutinise the incentive fee architecture. Not all incentive fee structures are equivalent. The most investor-friendly designs include a cumulative or "look-back" hurdle, which requires the manager to recover prior periods of underperformance before incentive fees resume accruing. These structures are rare. Their presence is a meaningful positive signal; their absence — particularly when combined with a short measurement period — is a yellow flag worth noting in the manager evaluation.
Third, treat internal management as a quality signal, not merely a cost advantage. The scarcity of internally managed vehicles in the closed-end and BDC universe is not accidental. Building and maintaining an internal investment team requires genuine conviction in the strategy and a willingness to accept the fixed cost base that comes with it. This self-selection tends to attract managers with longer time horizons and lower tolerance for short-cycle AUM-maximisation behaviour. In practice, this shows up in the data: internally managed vehicles have historically exhibited lower leverage ratios, more disciplined dividend policies, and more stable NAV-per-share trajectories through credit stress cycles — not universally, but with enough consistency to be analytically meaningful.
A necessary caveat here is that management structure is not destiny. A well-governed, conservatively run externally managed fund can and does outperform a poorly run internal vehicle over a given period. The analysis here is probabilistic, not deterministic.
What it argues is something more modest but ultimately more durable: over a full market cycle, compounding is unforgiving of structural friction. Management economics are structural friction by definition.
For investors with long enough time horizons to feel the full effect of that friction — and for the advisors constructing portfolios on their behalf — the management structure question deserves to move from the footnotes to the top of the due diligence stack.
Stop Monitoring the Thesis. Start Running It.
Everything in this piece points toward the same conclusion: the structural details of a closed-end vehicle — fee architecture, incentive alignment, leverage discipline — compound relentlessly over time. Identifying those details through rigorous analysis is the first step. The harder problem, for advisors managing multiple client portfolios, is acting on that analysis consistently and at scale.
That is exactly the problem Surmount Wealth is built to solve. Surmount's platform allows advisors and portfolio managers to translate any investment thesis into a fully automated, rules-based trade strategy — either by selecting from a library of prebuilt strategies or by configuring a custom strategy to their exact specifications. Once live, the strategy executes automatically across client accounts, removing execution lag, emotional override, and the manual overhead that causes even well-researched theses to underperform in practice.
A hypothetical example: the Structurally Aligned Income Strategy
The following is a hypothetical strategy concept for illustrative purposes only. It does not represent an existing Surmount product and is not investment advice.
To make this concrete: imagine a strategy built around the analysis in this piece. Call it the Structurally Aligned Income Strategy. Its screening universe is the investable BDC and closed-end credit universe. Its first filter is management structure — externally managed vehicles are excluded entirely, or down-weighted significantly, reducing the fee-drag and misalignment risks described above. From the remaining universe, the strategy applies a second filter: effective fee on equity, calculated at current leverage, must fall below a defined threshold. Third, distribution coverage must exceed 105% on a trailing four-quarter basis, screening out vehicles where income is being supplemented by return of capital. Finally, the strategy monitors leverage ratios on a quarterly basis and trims positions in any vehicle that breaches a pre-set debt-to-equity ceiling — a rules-based circuit breaker against the leverage creep that typically precedes distribution cuts.
The result is a concentrated, high-conviction income sleeve that systematically excludes the structural friction this article describes — and rebalances automatically when those conditions change. No manual monitoring. No spreadsheet. No execution delay while the next quarterly review catches up with a deteriorating position.
That is the power of automating a thesis rather than simply writing about one. Any framework an advisor has spent time developing — sector rotation rules, yield-screen logic, macro-triggered rebalancing — can be built into a Surmount strategy and deployed consistently across an entire book of business.
Book a demo with Surmount Wealth today → See how your existing investment frameworks can be converted into automated, scalable strategies. Visit surmountwealth.com or contact your Surmount representative to schedule a personalised walkthrough.
Related


Get Started
Experience the full power of our SaaS platform with a risk-free trial. Join countless businesses who have already transformed their operations. No credit card required.

FAQs
How can this impact my business?
How long does an this take to implement?
Will we need to make changes in our teams?

Still have a question?
Get in touch with our team.

