
Blog

The April 15th deadline looms, but choosing between direct indexing and ETFs isn't a last-minute decision. As minimum investments drop from $250,000 to $1,000, clients are asking whether tax alpha justifies the extra fees. The answer depends entirely on their tax bracket, portfolio size, and whether they'll stick with the strategy long enough to come out ahead.
What the Tax Alpha Research Actually Shows
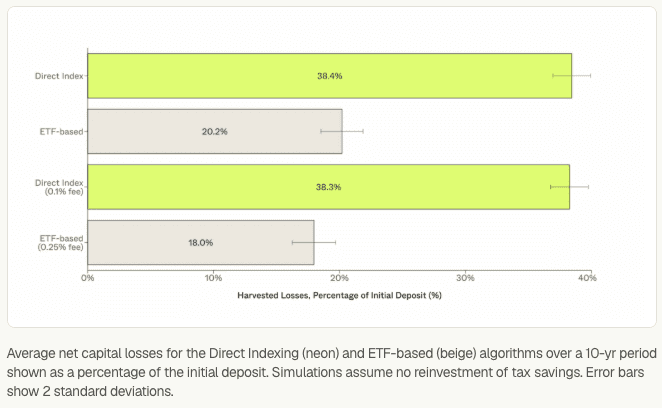
Direct indexing's pitch is simple: harvest losses on individual stocks while maintaining index exposure. Morgan Stanley research puts the benefit at 0.3% to 1.0% annually, though that varies wildly based on market conditions and tax rates. More optimistic simulations comparing S&P 500 direct indexing to SPY show 2%+ annual improvement at the highest tax brackets.
Here's why it works: Even when the S&P 500 gained 23% in 2024, over 100 stocks dropped more than 5%. Direct indexing captures those individual losses. ETF investors only get one shot—sell the entire fund or hold everything.
The catch? These numbers represent potential, not guarantees. Your actual results depend on when you start, how volatile markets get, and how quickly your positions lock up with unrealized gains.
When Direct Indexing Actually Makes Sense
Direct indexing works for specific situations. Before recommending it, verify the client meets these criteria:
Tax situation:
Combined federal and state rates above 30%
Substantial realized gains needing offsets
Short-term capital gains from other activities
Portfolio characteristics:
At least $100,000 in taxable accounts (ideally $250,000+)
Concentrated positions requiring diversification
10+ year time horizon
Market environment: Volatility creates opportunities. Northern Trust's 2025 data showed 76 volatility shocks versus 15 in 2024. For a $2 million portfolio, that volatility could have generated $100,000 to $400,000 in harvested losses depending on how aggressively you harvest.
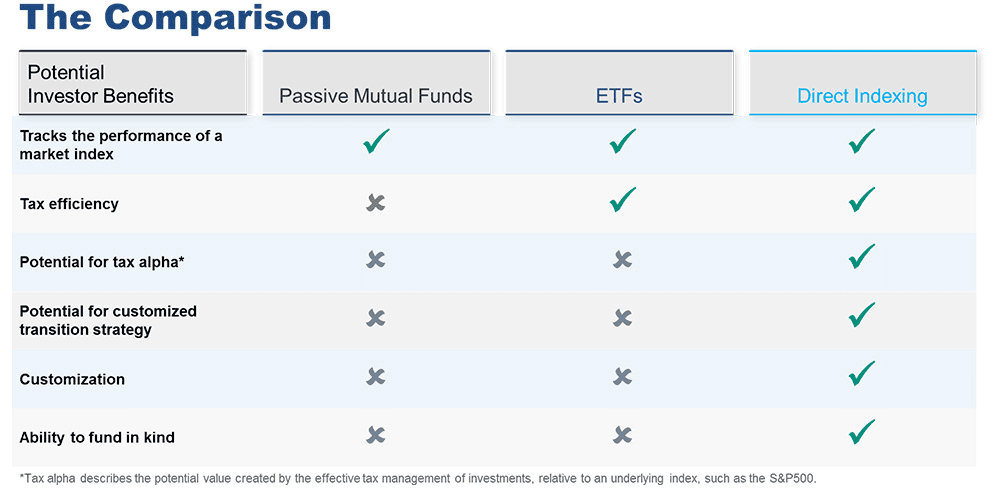
What ETFs Still Do Better
ETFs deliver tax efficiency without the headaches. Expense ratios run 0.03% to 0.20% for broad market funds. The creation/redemption mechanism minimizes capital gains distributions. And you're managing one position, not 500.
The pair-swap strategy works: sell VTI, buy ITOT when markets dip. You harvest the loss without leaving the market. Research from the Financial Planning Association notes that clients making regular contributions naturally create multiple lots with different cost bases—enabling harvesting during volatility without managing hundreds of stocks.
If your client contributes monthly or quarterly, they're already building a structure that supports basic tax-loss harvesting through ETFs alone.
The Math That Actually Matters
Fee differences determine whether tax alpha pays off. Current direct indexing fees range from 0.19% at Public.com to 0.40% at Schwab and Fidelity. ETF expense ratios typically run 0.03% to 0.20%.
On a $500,000 portfolio, the difference between 0.40% direct indexing and 0.03% ETF costs $1,850 annually. Tax alpha needs to exceed that figure just to break even—requiring roughly 0.37% additional after-tax return before you've added any value whatsoever.
Here's the calculation advisors should run: Take the fee differential, multiply by portfolio size, and ask whether the client's tax bracket and expected volatility can realistically generate enough harvested losses to cover that cost and produce a net benefit.
2026 Market Conditions and Timing
Despite strong index performance, individual stock dispersion creates harvesting opportunities. In 2024, 433 stocks in the Schwab 1000 Index lost value even as the index surged. That pattern continues—sector rotation and earnings surprises constantly create losers within winning indices.
For 2026 specifically:
Year-end 2025 volatility created harvesting opportunities
Q1 positioning enables early-year loss capture
April 15th creates urgency for utilizing carryforward losses from 2025
Clear Decision Framework
Choose ETFs when:
Portfolio under $100,000
Tax bracket below 30%
Client values simplicity
Time horizon under 5 years
Most assets in retirement accounts
Choose direct indexing when:
Portfolio exceeds $250,000 in taxable accounts
Tax bracket above 35%
Concentrated positions need diversification
Significant annual gains require systematic offsets
Client comfortable with complexity
The hybrid play: Use ETFs for core exposure, direct indexing for tax-sensitive allocations. You get simplicity where it matters and optimization where it pays off.
What to Run Before April 15th
Model these scenarios for clients considering the switch:
Tax projection: Calculate 2026 liability under current ETF approach versus direct indexing. Include fee differentials in the comparison.
Break-even timeline: Project 5-year and 10-year outcomes. How long until cumulative tax savings exceed cumulative additional fees?
Complexity assessment: Can the client handle hundreds of positions, complex tax reporting, and tracking error versus their benchmark?
The Conversation With Clients
Stop positioning this as "sophisticated strategy versus basic approach." Frame it as matching the right tool to their specific situation.
For clients under $100,000: "ETFs with strategic harvesting during volatility give you tax efficiency without paying a complexity premium."
For clients above $250,000 in high brackets: "Direct indexing could save you $X annually in taxes. It costs $Y more in fees and requires more complex reporting. Let's model whether the net benefit justifies the switch."
For the $100,000-$250,000 range: "You're in the zone where it might make sense depending on your specific tax situation. We need to run your numbers before deciding."
Reality Check
Direct indexing isn't magic. It's a tool that works extremely well for the right clients and produces mediocre results for everyone else. Industry research correctly notes that tax alpha requires ongoing contributions, decays as positions appreciate, and involves tracking error.
For high-net-worth clients in top tax brackets with long horizons, that 1-2% annual tax alpha compounds to serious wealth preservation. For smaller accounts or shorter timeframes, ETF simplicity and lower costs often win.
Run the actual numbers. Model real tax scenarios. Compare net outcomes after all fees. The right answer isn't which strategy sounds more impressive—it's which one produces better after-tax wealth for the specific client sitting across from you.
Related


Get Started
Experience the full power of our SaaS platform with a risk-free trial. Join countless businesses who have already transformed their operations. No credit card required.

FAQs
How can this impact my business?
How long does an this take to implement?
Will we need to make changes in our teams?

Still have a question?
Get in touch with our team.

