The S&P 500 Concentration Bubble and Portfolio Risk

The S&P 500 Concentration Bubble and Portfolio Risk
The S&P 500 concentration bubble is no longer a fringe concern whispered at investment conferences. It is a structural reality that every portfolio manager and registered investment advisor needs to confront directly. When two companies account for roughly 15% of total U.S. equity market capitalization, and a single sector represents over half the index, the assumptions underlying passive, benchmark-relative investing deserve serious scrutiny.
What Is Market Concentration Risk and Why Does It Matter Now
Market concentration risk refers to the outsized exposure a portfolio carries when a small number of holdings drive the majority of returns — and losses. In a market cap weighted index, capital flows mechanically toward the largest companies, regardless of valuation. As those companies grow, they attract more passive capital, which inflates their prices further, which increases their index weight. The cycle is self-reinforcing.
Today, that cycle has produced a top heavy S&P 500 portfolio risk profile unlike anything in modern market history. Technology and tech-adjacent firms now represent over 55% of overall market capitalization — a level of concentration that dwarfs even the peak of the dot-com era.
How Today's Concentration Compares Historically
At the height of the Internet Boom, the top 10 S&P 500 constituents represented roughly 25% of total index market cap. Today that figure is meaningfully higher, and the dominance is narrower — concentrated in fewer names rather than spread across a broader technology cohort. Valuation metrics including the Shiller PE ratio, the Buffett Indicator, and price-to-sales ratios on the NASDAQ all sit at levels that have historically preceded significant corrections.
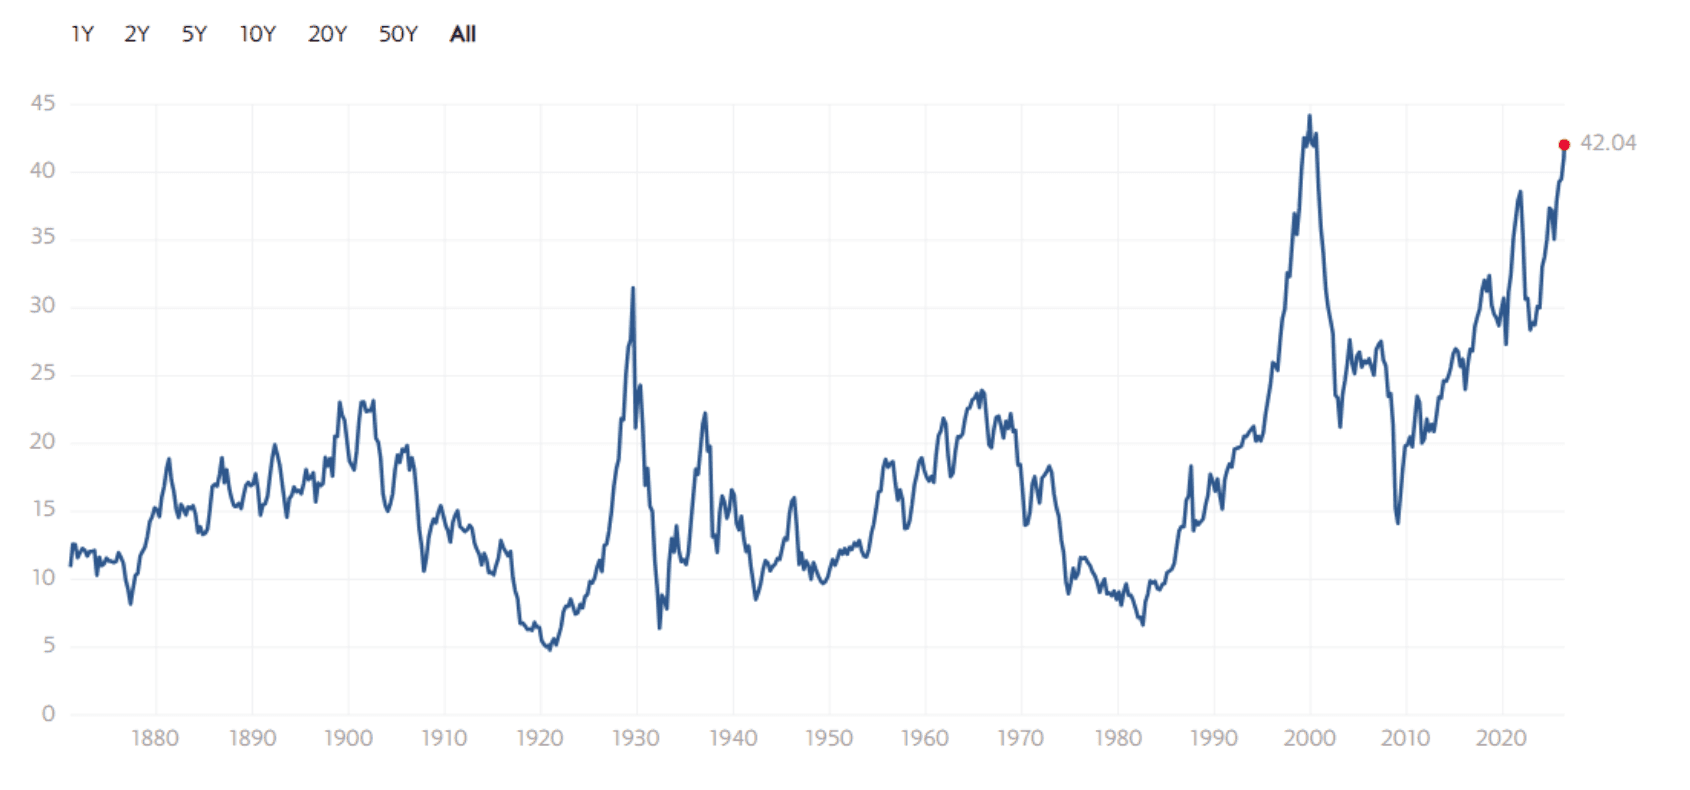
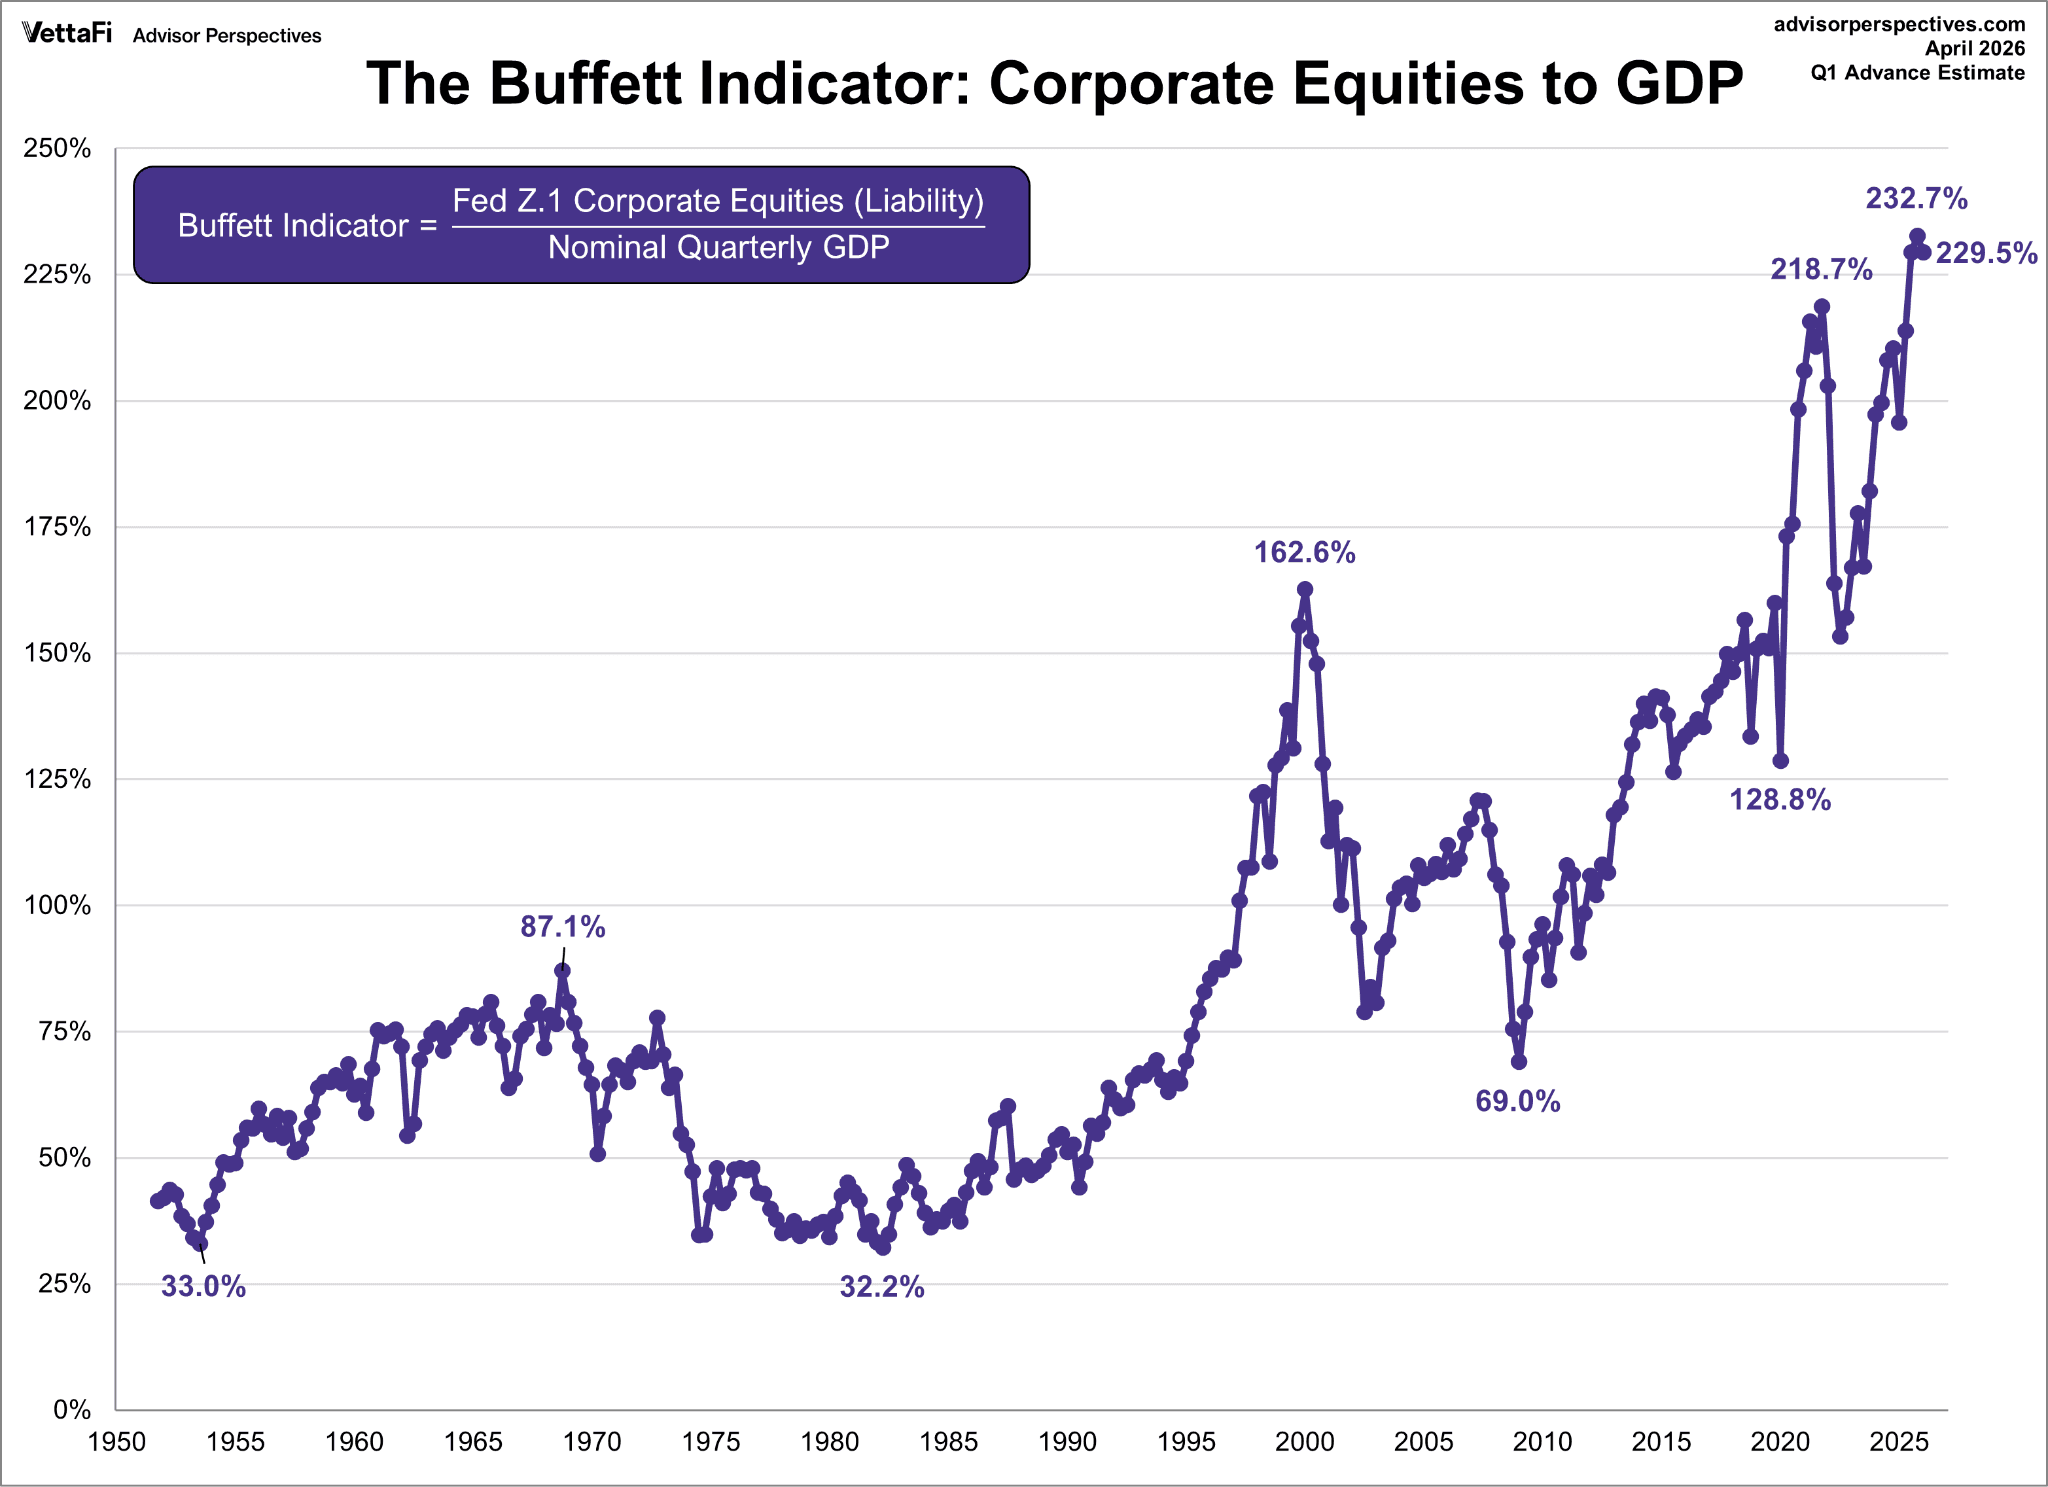
The index concentration historical comparison is unambiguous: we are in unprecedented territory.
The Role of Passive Investing in Amplifying Concentration
The explosive growth of passive investing over the past decade has been the structural engine behind this dynamic. Market cap weighted index overweight in mega-cap technology is not the result of active allocation decisions — it is the default output of trillions of dollars flowing into index funds. Every dollar that enters an S&P 500 ETF is algorithmically distributed in proportion to existing market caps, passively buying more of what is already most expensive. This passive investing concentration risk is baked into the architecture of modern portfolio construction and largely invisible to end clients.
The Benchmark Hugging Trap: How Closet Indexing Creates Hidden Exposure
Many active managers who charge active fees are running portfolios that closely mirror their benchmark in composition and weighting. This practice — known as closet indexing — has been commercially rational during a decade-long bull market driven by the same mega-cap names dominating the index. But it has quietly loaded client portfolios with concentration exposure that is rarely disclosed transparently.
The closet indexing risk advisors face is both fiduciary and commercial. When the concentration bubble deflates, portfolios that hugged the benchmark on the way up will suffer benchmark-level drawdowns — with no active management to show for it.
When Staying Close to the Benchmark Becomes a Liability
The benchmark hugging risk crystallizes in a specific scenario: a sharp, valuation-driven derating of the top five to ten index constituents. Because these names carry such enormous index weight, even a 20–30% correction in that cohort produces index-level drawdowns that feel indistinguishable from a broad market crash — except that the other 490 companies in the index may be relatively unaffected. Portfolio concentration bubble indicators, including negative equity risk premiums and record profit margins under pressure, suggest that scenario is not theoretical.
Valuation Signals Hiding Inside the Concentration Bubble
The S&P 500 concentration bubble is a story with a valuation dimension. This makes it highly precarious. With the index trading above 32 times earnings, the implied earnings yield sits around 3.1%, meaningfully below the current 10-Year Treasury yield. This produces a negative equity risk premium — a rare condition in which investors are accepting lower expected returns from equities than from risk-free government bonds.
These bubble indicators portfolio managers track — the equity risk premium 2025 inversion, stretched price-to-sales multiples, and record net profit margins now facing cost headwinds from energy prices and tariffs — collectively point to a market where the margin for error is thin and concentrated at the top.
How to Manage Concentration Risk Without Abandoning the Market
Reducing concentration exposure does not require abandoning equities. Several tactical approaches deserve consideration:
Active portfolio management concentration strategies can deliberately underweight the largest index constituents while maintaining broad market exposure. Equal weight vs market cap weight analysis consistently shows that equal-weighted index construction has historically outperformed during periods following peak concentration. Factor-based tilts toward value, quality, and smaller capitalizations can meaningfully reduce top-heavy exposure without sacrificing diversification.
The challenge for most advisors is implementation — translating a concentration thesis into a systematically managed, rules-based portfolio is operationally complex without the right infrastructure.
Automating Concentration Risk Management for Modern Portfolios
This is where technology changes the equation. Automated portfolio rebalancing tools now allow advisors and self-directed professionals to encode a concentration risk thesis directly into a systematic strategy — one that monitors exposures, rebalances according to defined rules, and executes without emotional drift or operational delay.
Rather than making ad hoc adjustments when concentration becomes uncomfortable, a rules-based approach enforces discipline at every market condition. As our analysis of rebalancing frequency shows, systematic discipline consistently outperforms discretionary timing.
Conclusion
The S&P 500 concentration bubble is not a prediction — it is a measurable condition visible across valuation metrics, market structure data, and capital flow dynamics. For professionals managing client portfolios, the question is not whether concentration risk exists. It is whether your current portfolio construction is equipped to manage it systematically.
🚀 Put This Thesis to Work with Surmount Wealth
Reading about concentration risk is one thing. Automating a portfolio strategy around it is another.
Surmount Wealth gives professional and self-directed investors access to prebuilt and fully customizable automated trade strategies that can be applied directly to existing brokerage accounts — no fund transfers, no coding required.
To illustrate the point, consider a hypothetical strategy we might call the "De-Concentrated Core" (hypothetical concept only — not a live strategy or investment advice): a rules-based approach that caps individual position weights at 3%, systematically underweights the top 10 S&P 500 constituents relative to their index weight, rotates toward equal-weighted sector exposure, and rebalances monthly based on concentration thresholds. A strategy like this would directly encode the thesis discussed in this article into an automatically managed portfolio.
This is exactly the kind of strategy Surmount Wealth's platform is built for. Whether you want to deploy a prebuilt strategy from our library or build your own custom algorithm around any macro or structural thesis, the infrastructure is ready.
Your next step is simple.
Book a Demo Now → and see how Surmount Wealth can help you automate your highest-conviction ideas — before the market does the rebalancing for you.
Frequently Asked Questions
What is the S&P 500 concentration bubble and why does it matter?
The S&P 500 concentration bubble refers to the historic overweight of a handful of mega-cap stocks dominating index returns. It matters because it exposes benchmark-tracking portfolios to outsized drawdown risk if those few names correct sharply.
How does passive investing increase market concentration risk?
Passive investing mechanically directs capital into the largest index constituents through market cap weighted index overweight, amplifying concentration with every dollar that flows into an index fund. This creates a self-reinforcing cycle that inflates valuations regardless of fundamentals.
What are the warning signs of a portfolio concentration bubble?
Key portfolio concentration bubble indicators include a negative equity risk premium, historically elevated Shiller PE ratios, and a small number of stocks driving the majority of index returns. When these signals align simultaneously, the risk of a sharp mean-reversion event increases significantly.
What is closet indexing and why is it a risk for advisors?
Closet indexing is when active managers mirror their benchmark so closely that clients bear full concentration exposure while paying active management fees. The closet indexing risk for advisors is both a fiduciary liability and a reputational one when the benchmark corrects.
How can portfolio managers reduce concentration risk without exiting the market?
Strategies like equal weight vs market cap weight construction, factor tilts toward value and quality, and automated portfolio rebalancing tools can systematically reduce top-heavy exposure. These approaches allow managers to stay invested while encoding a disciplined concentration risk framework directly into portfolio rules.