
Blog

Equal-Weight vs. Cap-Weight: What Index Bifurcation Is Really Telling Portfolio Managers
The S&P 500 is up sharply from its March lows. Headlines are constructive, sentiment has improved, and casual observers could be forgiven for concluding that the equity market is broadly healthy. It is not. Beneath the surface of a resilient-looking benchmark lies one of the more consequential divergences in recent memory — one that portfolio managers and investment advisors cannot afford to misread.
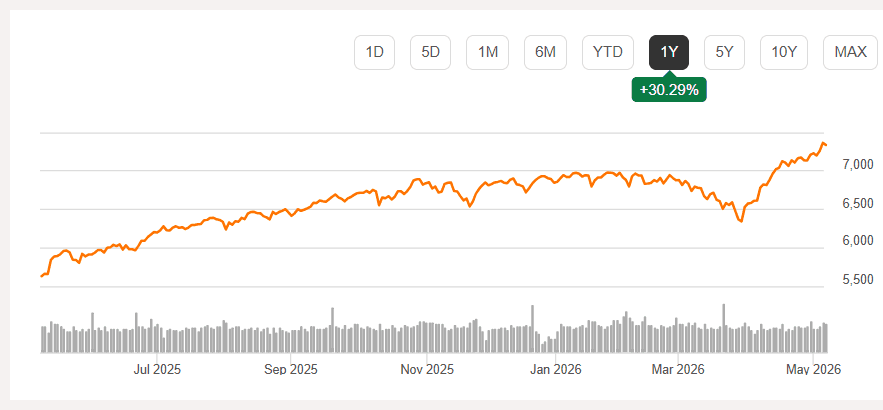
The cap-weighted S&P 500 has recovered approximately 16% from its late-March trough. The equal-weighted version of the same index — which assigns identical exposure to all 500 constituents regardless of market capitalization — has recovered roughly half that. Same stocks. Same index. Radically different picture.
This divergence is not a technical curiosity. It is a signal. And understanding what it is signaling is arguably one of the most important analytical tasks facing professional allocators right now. When the performance of a benchmark is being driven almost entirely by a small cluster of mega-cap names, the benchmark itself becomes a distorted lens through which to evaluate market health, portfolio risk, and forward return expectations.
The Mechanics of Bifurcation
The structural driver of this divergence is well understood but consistently underappreciated in its implications. As assets continue flowing into cap-weighted passive vehicles — which now represent the dominant share of equity fund flows — the mechanics of index construction ensure that the largest constituents receive proportionally greater inflows. This is not driven by earnings revisions, valuation re-ratings, or fundamental reappraisal. It is a function of index mathematics.
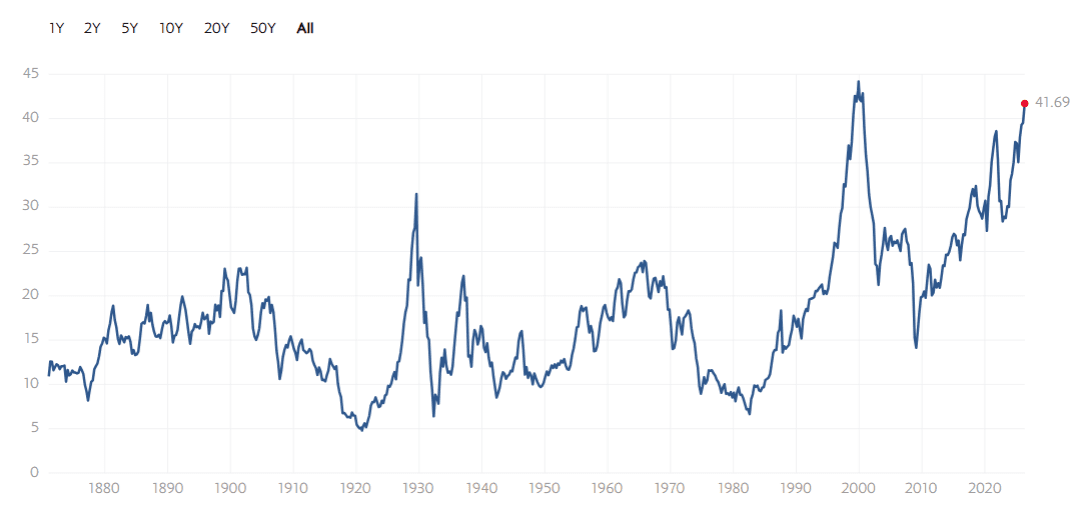
The result is a momentum feedback loop. Rising prices increase index weight, which attracts more passive inflows, which drive prices higher still. At current levels, the top ten holdings of the cap-weighted S&P 500 account for a greater share of index weight than at any point since the late 1990s. For context, the Magnificent Seven alone carry a weighting that exceeds the combined representation of the bottom 400 constituents.
What History Tells Us About These Episodes
This is not the first time the market has experienced extreme cap concentration. The late 1990s technology bubble and the Nifty Fifty era of the early 1970s are the most instructive historical parallels. In both cases, a narrow group of high-momentum, high-valuation names drove headline index performance while broad market breadth deteriorated steadily underneath. In both cases, the resolution was mean reversion — painful, prolonged, and asymmetric to the downside for investors who had conflated benchmark performance with genuine market breadth.
Breadth Indicators Worth Monitoring
Professional allocators looking to track this divergence in real time should be watching:
The NYSE Advance-Decline Line — persistent divergence from price highs is one of the most reliable early warning signals in technical market analysis
Percentage of S&P 500 constituents trading above their 200-day moving average — currently well below levels consistent with a healthy broad market rally
New 52-week highs vs. new 52-week lows — when indices are making new highs but this ratio is contracting, the rally lacks genuine participation
Equal-weight to cap-weight ratio — the ratio itself is a clean, real-time summary of bifurcation intensity and has historically been a useful mean-reversion indicator
When multiple breadth measures deteriorate simultaneously while cap-weighted indices advance, the divergence rarely resolves in favour of the headline number.
Portfolio Implications for Professional Allocators
Here is the uncomfortable reality for advisors benchmarked against the cap-weighted S&P 500: positioning defensively right now means underweighting the precise names that are driving benchmark returns. That creates tracking error, which creates client conversations, which creates institutional pressure to capitulate back into concentration risk at exactly the wrong time.
This is not a new dilemma, but it is acutely relevant given current conditions. The practical answer is to reframe the conversation — both internally and with clients — around risk-adjusted returns and drawdown management rather than relative performance over a trailing quarter. A benchmark that is being carried by seven stocks trading at historically extreme valuations is not a neutral reference point. It is itself a concentrated active bet.
A Framework for Acting on the Signal
Sustained bifurcation of this magnitude has historically implied two things about forward returns. First, the equal-weighted cohort tends to outperform on a relative basis once mean reversion begins. Second, the cap-weighted index tends to underperform its own historical averages over the subsequent twelve months.
For allocators, this suggests a few practical considerations: a deliberate tilt toward quality and lower-volatility factor exposures within equity allocations, selective reduction in passive cap-weighted vehicles in favour of equal-weight or fundamentally-weighted alternatives, and building tactical liquidity — short-duration fixed income, T-bills, or cash — that preserves optionality heading into what seasonal and valuation data both suggest is a vulnerable period for risk assets. We have also suggested a barbell strategy in the past as one route investors could take with these dynamics.
The market is not weak because the headlines say so. It is weak because the internals say so. Knowing the difference is precisely what separates professional capital allocation from passive index-hugging.
Put Your Thesis on Autopilot with Surmount Wealth
Reading the market correctly is only half the battle. The other half is executing — consistently, dispassionately, and without the behavioural drag that causes even the most analytically rigorous advisors to hesitate at precisely the wrong moment.
That is exactly what Surmount Wealth's automated trade strategy platform is built for.
Whether you want to deploy a prebuilt strategy from Surmount's library or build a fully custom rules-based system around your own investment thesis, Surmount gives professional advisors and portfolio managers the infrastructure to automate execution with precision. No more manually monitoring breadth indicators at 3pm. No more second-guessing entries during volatile tape action. Your thesis runs — exactly as designed.
What That Could Look Like in Practice
Consider the dynamics discussed in this post. An advisor who wanted to systematically act on the equal-weight/cap-weight divergence signal could hypothetically construct a rules-based rotation strategy around exactly this thesis. Imagine a strategy — call it the Index Bifurcation Rotation Model — built around the following logic:
Entry trigger: When the equal-weight to cap-weight ratio drops below a defined threshold — signalling peak concentration and elevated mean-reversion probability — the strategy begins rotating out of cap-weighted passive exposure and into equal-weight or factor-tilted alternatives
Breadth confirmation: The rotation is only executed when two or more supporting breadth indicators — advance-decline divergence, percentage of stocks above their 200-day moving average, new highs/lows ratio — confirm deteriorating market internals
Defensive allocation: Simultaneously, the strategy scales into short-duration fixed income (such as municipal bonds) or cash equivalents up to a predefined portfolio ceiling, reducing drawdown exposure during the seasonally weak window
Re-entry rules: When breadth indicators collectively recover above threshold and the equal-weight index begins outperforming on a trailing basis, the strategy systematically rotates back into risk assets
This is a hypothetical strategy for illustrative purposes only, and does not constitute investment advice or a real product offering from Surmount Wealth. It is intended solely to demonstrate the type of thesis-driven automation the platform makes possible.
This kind of systematic, signal-driven execution is exactly what separates advisors who act on their analysis from those who write about it and then watch the opportunity pass.
Ready to Automate Your Thesis?
Surmount Wealth works with professional advisors and portfolio managers to build strategies that are as sophisticated — or as straightforward — as your process demands. Prebuilt strategies are available for immediate deployment. Custom builds are designed around your specific framework, risk parameters, and client mandates.
The market is giving you the signal. Surmount helps you act on it.
👉 Book a demo with Surmount Wealth today and see how your next investment thesis can be transformed into a fully automated, rules-based strategy — before the next signal fires.
Related


Get Started
Experience the full power of our SaaS platform with a risk-free trial. Join countless businesses who have already transformed their operations. No credit card required.

FAQs
How can this impact my business?
How long does an this take to implement?
Will we need to make changes in our teams?

Still have a question?
Get in touch with our team.

