
Blog

Rethinking The Buffett Indicator for Equity Allocation
For decades, the "Macro 101" playbook for equity allocation has been deceptively simple: find the countries with the highest projected GDP growth and overweight their domestic indices. Logically, the idea makes total sense. Rising national output should, in theory, fuel corporate top lines.
Afterall, this is why the Buffett Indicator is so frequently cited. By measuring the total market capitalization of a country’s stocks against its Gross Domestic Product, investors seek a "fair value" anchor. The more the Buffett indicator deviates from its historic baseline, the more we feel an instinctive pull toward the mean. As such, we treat the domestic economy as the gravity that must eventually bring valuations back to earth.
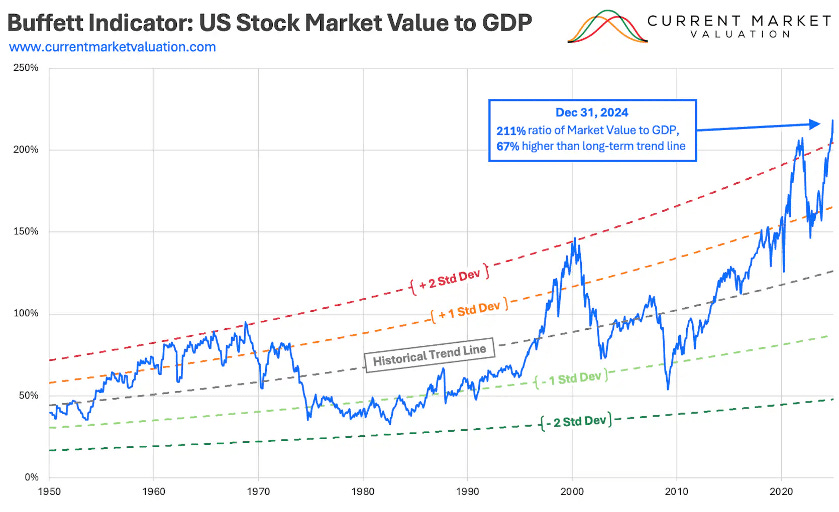
However, for the modern portfolio manager, this Macro 101 anchor is increasingly being seen as a structural liability. This comes especially as the physical location of a corporate headquarters has become a poor proxy for where its value is actually created. In a world of borderless supply chains and digitized services, the "gravity" of domestic GDP is losing its pull.
We are witnessing a fundamental decoupling of national economic health from equity performance. While a country's GDP measures the value of goods and services produced within its borders, the modern blue-chip index is an assembly of global entities that treat their home turf as merely a tax jurisdiction or a talent hub, not their primary market.
Buffett Indicator’s Reliance On “Faulty” Data
One major reason as to why an overreliance on the Buffett indicator may be a flawed approach to take is because of the fundamental mismatch between a nation's economic engine and its public equity markets. When a portfolio manager looks at a country’s GDP, they are seeing the total value of all goods and services produced. However, the stock index is a curated, often top-heavy slice of that economy that may be skewed by historical legacy or the preference of private vs. public capital.
For instance, in many European and Commonwealth markets, the GDP shows signs of shifting toward tech and services, but the stock index remains dominated by "Old Economy" giants—banks, miners, and manufacturers. Another example would be Australia, whose GDP is increasingly diversified, yet its equity index remains a "proxy" for global commodity prices due to the massive weighting of materials and financials.
Given these dynamics, assuming that GDP-related metrics (such as GDP growth) should be proportionate to equity capitalization, could be a flawed approach to take.
Furthermore, in some high-growth economies, the most dynamic sectors are often held in private equity or are state-owned, meaning they contribute to GDP but are entirely absent from the investable index.
Why This Matters for Allocation
If you allocate based on domestic GDP growth forecasts, you are making a bet on the entire economic output. But your returns are actually tied to the specific earnings of the companies in the index.
Inverse Correlations: You might see a country with robust 4% GDP growth, but if its stock index is 40% "Zombie" banks or struggling legacy industrial firms, the equity returns will stay flat or decline.
Sector Drag: A country’s manufacturing sector might be thriving (boosting GDP), but if the listed companies in that sector are facing margin compression due to global competition, the "macro anchor" of high GDP growth becomes a false signal.
The Resulting "Sector Tilt"
This leads to unintended bets. An advisor seeking "German Engineering" through the DAX might unintentionally be taking on massive exposure to global automotive cyclicality, rather than the stable, domestic-oriented "Mittelstand" companies that actually drive the local economy but aren't listed on the exchange.
The Statistical Paradox
Several landmark studies, most notably by Jay Ritter and Elroy Dimson, have highlighted a zero to negative correlation between long-term real GDP per capita growth and real equity returns.
In fact, several cross-sectional studies of dozens of countries over 100-year periods highlight that the correlation coefficient often hovers between 0 and 0.4.
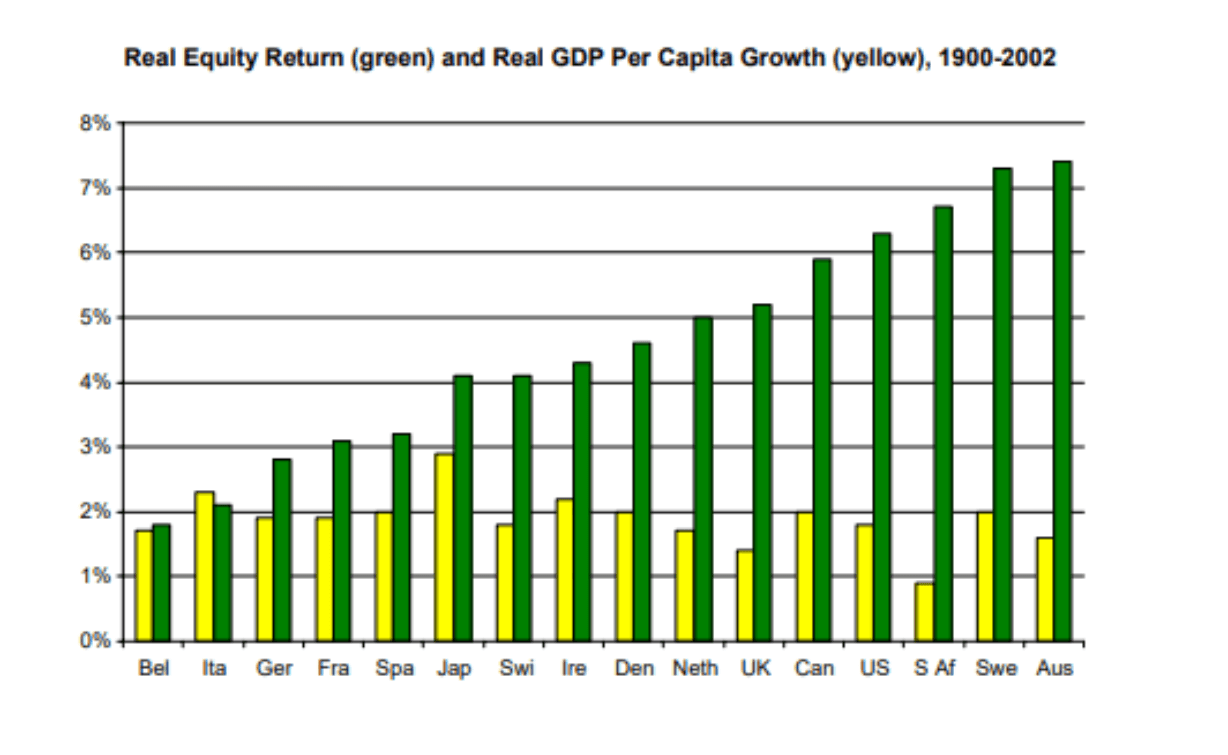
Of course, this implies that if a person had invested in the fastest-growing economies of the last 30 years (e.g., China), their equity returns would likely have lagged significantly behind slower-growing, "stagnant" developed markets.
There are three primary “leakages” that help explain this disconnect:
Anticipation and Valuation
Markets are forward-looking; GDP is coincident or lagging. By the time a country's high growth is "official" in the macro data, investors have usually already priced it in. This leads to valuation compression: you pay a high multiple for growth that is already consensus, leaving no room for unexpected upside.
Capital Dilution (The "EPS Leak")
GDP growth often comes from the creation of new companies and massive capital expenditures. However, as an equity investor, you own a slice of existing companies.
When a country grows its GDP by building new infrastructure or launching new startups, it often requires issuing massive amounts of new equity.
This dilutes existing shareholders.
As such, even when GDP grows, Earnings Per Share (EPS) stays flat.
The "Productivity for Consumers" Trap
Economic growth is often driven by technological shifts that increase productivity. While this is great for GDP and consumers (cheaper goods), the benefits rarely accrue to the companies themselves due to intense competition.
For example, the airline and textile industries added trillions to global GDP over the last century while destroying massive amounts of shareholder wealth.
What all this basically means is that, when you anchor a portfolio to domestic GDP, you are essentially betting on economic activity rather than shareholder value.
To move the needle, advisors should shift the focus toward Capital Intensity and Governance. A slow-growth economy with high capital discipline (share buybacks, dividends, and moat protection) will almost always outperform a high-growth economy that treats equity as a cheap fuel for national expansion.
This is where Surmount changes the game for Investment Advisors and Portfolio Managers.
Our platform moves beyond "geographic silos" by using automated, data-driven strategies that anchor your allocations to what actually matters: global earnings, institutional liquidity, and momentum—not lagging macro indicators.
Why Surmount?
Automated Precision: Remove the emotional friction of rebalancing across complex global themes.
Data-First Allocation: Our strategies can help to exploit the divergence between economic growth and shareholder yield.
Institutional Scalability: Manage sophisticated, multi-asset strategies with the efficiency of a digital-first desk.
Book your demo now!
Related


Get Started
Experience the full power of our SaaS platform with a risk-free trial. Join countless businesses who have already transformed their operations. No credit card required.

FAQs
How can this impact my business?
How long does an this take to implement?
Will we need to make changes in our teams?

Still have a question?
Get in touch with our team.

