
Blog

Recession Indicators Every Portfolio Manager Should Track
Professional investors have always known that timing matters. But when it comes to recession indicators, the cruel irony is that the most widely cited data — GDP contraction, rising unemployment, falling corporate earnings — arrives only after the damage is done. By the time the NBER makes an official call, equity markets have typically already priced in six to twelve months of deterioration. This is a dynamic we explored in depth in our earlier analysis of whether a 2026 recession is already underway. For portfolio managers, the real edge is not in reading the headline. It is in building a systematic framework that sees the turn coming.
This post lays out the indicators worth tracking, why the leading versus lagging distinction is the most important analytical divide in macro investing, and how to translate signals into portfolio action before consensus catches up.
Why most recession indicators arrive too late
The NBER's Business Cycle Dating Committee is deliberately backward-looking. Its mandate is confirmation, not prediction, and it typically declares a recession six to eighteen months after one has begun. By that point, the average peak-to-trough equity drawdown is already well underway. Advisors who wait for official confirmation are not managing risk — they are documenting it.
The solution is not to predict recessions with precision. It is to build a scorecard of signals that, in combination, shift the probability distribution enough to justify defensive positioning. That requires understanding which indicators lead and which lag.
The leading vs. lagging distinction that changes portfolio strategy
Lagging indicators confirm what has already happened. Leading indicators increase or decrease in advance of broader economic shifts. The practical difference for a portfolio manager is significant — one tells you where you have been, the other tells you where you are likely headed.
What lagging indicators tell you (and why it is already too late)
Unemployment rate, GDP growth, and corporate profit margins are classic lagging indicators. They are valuable for understanding the depth and character of a cycle, but they are poor timing tools. By the time unemployment is rising sharply, the Federal Reserve has typically already tightened into weakness, consumer spending has already rolled over, and equity multiples have already compressed. Acting on lagging data is reactive by definition.
The leading indicators worth building into a macro overlay
The indicators that consistently move ahead of the broader economy — freight volumes, temporary employment, credit stress metrics, and manufacturing sub-components — give portfolio managers a genuine informational advantage. A macro overlay that weights these signals systematically can shift sector exposure, duration positioning, and cash allocation weeks or months before the consensus view changes.
Building a recession scorecard: the data sources that matter
No single indicator is sufficient. The value is in the combination — a scorecard approach that tracks multiple signals and flags when several deteriorate simultaneously.
Freight volume as a forward signal: what the Cass Freight Index reveals
The Cass Freight Shipments Index measures US freight volumes and goods movement, making it one of the most direct reads on real economic activity available. Unlike survey-based data, it reflects actual transactions. When freight volumes decline on a one-, two-, and three-year basis simultaneously — as they have been doing recently — it is a strong signal that underlying demand is contracting, not just pausing.
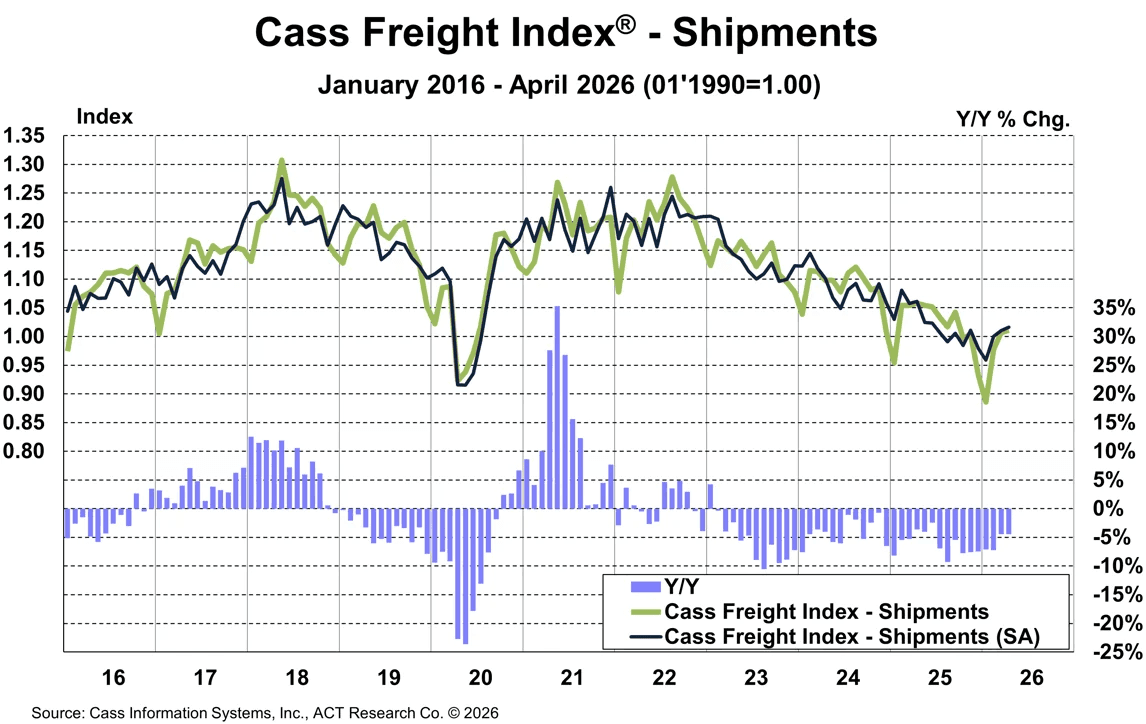
Advisors should track the year-over-year trend rather than the absolute level, and treat multi-year deterioration as a high-conviction warning.
Temporary help employment: the labour market's earliest warning
Temporary employment is one of the most reliable leading indicators within the labour market. When demand weakens, companies reduce contingent labour before touching permanent headcount. Conversely, when hiring intentions improve, temp employment recovers first. Sustained declines in temporary help services employment — independent of the headline payroll number — have historically preceded recessions by several quarters. It is a signal that is consistently underweighted relative to its predictive value.
Credit delinquency rates and what they signal for consumer-exposed portfolios
Consumer credit stress is materialising in real time. Credit card delinquency rates are approaching levels last seen in 2010. Auto loan delinquencies are at record highs on data stretching back over two decades. For portfolio managers with consumer discretionary, financial services, or auto sector exposure, these are not abstract macro concerns — they are direct balance sheet risks.

Rising delinquencies also compress future consumer spending capacity, creating a second-order drag that takes quarters to fully show up in earnings.
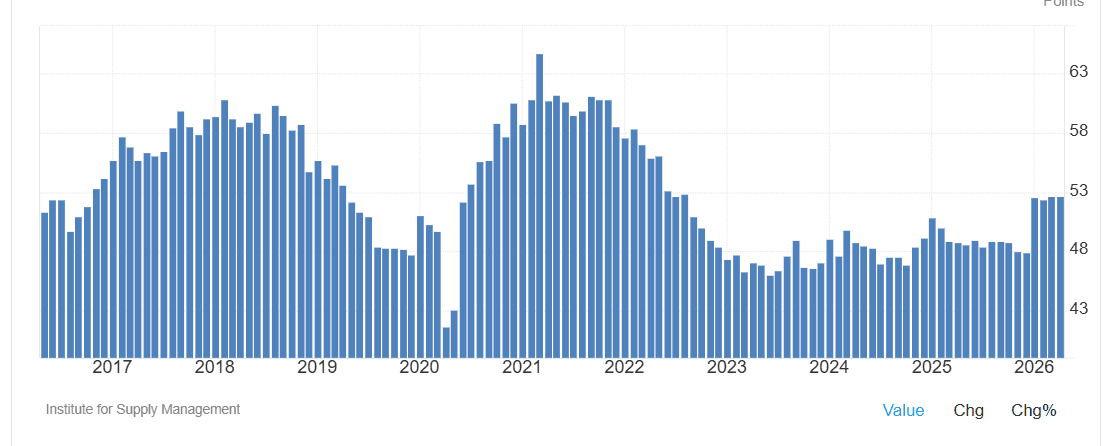
Reading PMI sub-components past the headline number
Headline PMI expansion can coexist with serious underlying deterioration. Manufacturing employment sub-indices can be contracting even while new orders and production readings push the composite into expansion territory. Portfolio managers who rely on the headline PMI number are missing the texture of what is actually happening inside the sector. The employment and order backlog sub-components are the ones worth monitoring closely — they tend to lead the headline by one to two quarters.
Translating recession signals into portfolio positioning
When multiple scorecard signals deteriorate simultaneously, the historical playbook points in a consistent direction: reduce cyclical exposure, increase defensive sector weighting, shorten duration in credit, and raise liquidity.
The specifics depend on the portfolio mandate, but the general principle holds across client types. For advisors navigating a data-dependent Fed alongside these signals, our adaptive allocation framework offers a practical complement to the scorecard approach outlined here. Ultimately, the scorecard is not a binary recession trigger, and is more of a probability dial that justifies incremental positioning shifts as evidence accumulates.
Why systematic execution matters more than accurate prediction
The most common failure mode for advisors is not analytical — it is operational. Managers who identify the right macro thesis often fail to act on it consistently because execution is manual, emotionally taxing, and difficult to scale across a book of clients. This is precisely where automated portfolio rebalancing tied to economic signals changes the equation. Systematic macro overlay investing removes the hesitation gap between signal and action, ensuring that when your scorecard crosses a threshold, the portfolio responds — not after a committee meeting, not after a client call, but immediately and consistently. And as we've shown previously, disciplined rebalancing consistently outperforms market timing regardless of the macro environment.
The bottom line for advisors navigating the current environment
Recession indicators are only as useful as the framework around them. Freight data, temporary employment trends, credit delinquency curves, and PMI sub-components are all publicly available. The edge is not access — it is synthesis, weighting, and systematic execution. Build the scorecard. Define your thresholds. And make sure your portfolio can actually respond when the signals align.
Automate your macro thesis with Surmount Wealth
Reading the signals is one thing. Acting on them — consistently, at scale, across every client portfolio — is another challenge entirely.
Surmount Wealth is an AI-driven investment platform that allows portfolio managers and investment advisors to build, test, and automate rule-based strategies directly on top of existing brokerage accounts. No fund transfers. No coding from scratch. Just professional-grade strategy infrastructure applied to your existing book.
Consider a hypothetical strategy built around exactly the dynamics discussed in this post — call it a Macro Stress Rotation strategy. It would systematically monitor a composite of the signals covered above: Cass Freight Index trend, temporary employment momentum, and consumer credit delinquency rates. When a defined number of those indicators deteriorate past set thresholds simultaneously, the strategy automatically rotates out of consumer discretionary and high-yield credit exposure and into defensive sectors, short-duration fixed income, and cash equivalents — then reverses the rotation when the signals recover. No manual intervention required. No emotion. No lag between signal and execution.
This is hypothetical, of course — but it illustrates exactly the kind of thesis-driven, rules-based automation that Surmount's platform is built to support. Whether you want to implement a strategy like this, adapt one from Surmount's prebuilt library, or build something entirely custom around your own macro view, the infrastructure is already there.
If you manage client portfolios and you are tired of identifying the right thesis but struggling to execute it systematically, Surmount Wealth was built for exactly that problem.
Book a demo today and see how your macro framework can become an automated, scalable strategy.
Frequently Asked Questions
What are the most reliable recession indicators for portfolio managers?
The most reliable recession indicators for portfolio managers are leading signals — freight volumes, temporary employment trends, and credit delinquency rates — rather than lagging data like GDP or unemployment, which confirm a downturn only after it has begun.
How do you use recession indicators to adjust portfolio strategy?
When multiple leading recession indicators deteriorate simultaneously, the historical playbook calls for reducing cyclical exposure, increasing defensive sector weighting, and raising liquidity — shifts that are most effective when executed systematically rather than reactively.
Why do most recession indicators arrive too late for investors to act on?
Most widely cited recession indicators, such as official NBER declarations and rising unemployment figures, are backward-looking by design and typically lag the actual economic turn by six to eighteen months, well after markets have already priced in the damage.
What is the difference between leading and lagging economic indicators?
Leading indicators — including the Cass Freight Index, temporary help employment, and PMI sub-components — move ahead of the broader economy, while lagging indicators like GDP growth and corporate earnings only confirm trends that are already well established.
How can investment advisors automate a macro recession strategy?
Platforms like Surmount Wealth allow advisors to build rule-based, automated portfolio strategies tied directly to macro recession signals, removing the execution lag between identifying a thesis and acting on it across a client book.
Related


Get Started
Experience the full power of our SaaS platform with a risk-free trial. Join countless businesses who have already transformed their operations. No credit card required.

FAQs
How can this impact my business?
How long does an this take to implement?
Will we need to make changes in our teams?

Still have a question?
Get in touch with our team.

