Why Credit Markets Are Snubbing the Tech Rally

Why Credit Markets Are Snubbing the Tech Rally
We are currently witnessing a profound divergence between equity sentiment and credit reality. While U.S. equity markets have continued a bullish trend into a fourth year, driven by AI enthusiasm and solid earnings, credit markets are exhibiting signs of strain, with wider spreads and rising refinancing needs.
To the casual observer, this looks like a standard "risk-on" environment. However, for the professional allocator, the underlying mechanics reveal a more complex and potentially fragile structure.
The primary driver of this equity price action appears to be a resurgence of the dispersion trade. As the S&P 500 Dispersion Index (DSPX) climbed toward the 38 level in mid-April, it signaled a market where idiosyncratic stock movements are expected to dominate, effectively driving implied correlations to cyclical lows. Historically, this "volatility decoupling"—where traders go long single-stock volatility while shorting index-level volatility—serves as a precursor to earnings season.
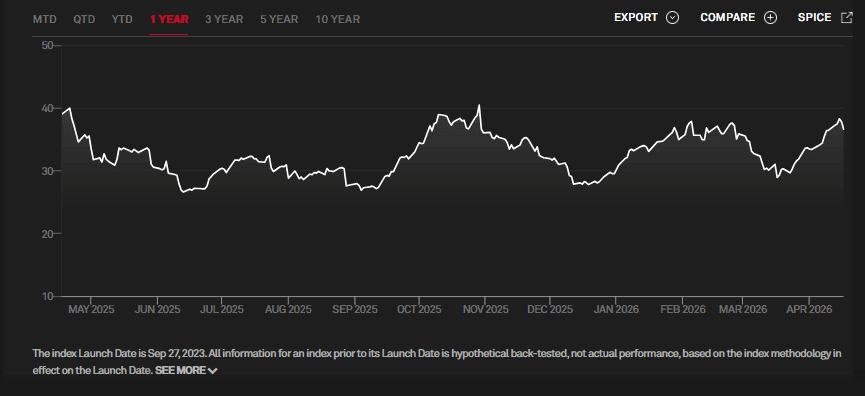
The anomaly, however, lies in the credit markets. While equity valuations for the index's heavyweights are expanding, the 5-year Credit Default Swap (CDS) spreads for these same names are failing to confirm the move. In several instances, credit spreads have actually widened or remained stubbornly elevated even as share prices hit multi-month highs.
This leads to a critical question for portfolio managers: Is the equity market correctly pricing in a new leg of AI-driven growth, or is the credit market accurately flagging a degradation in balance sheet quality and a rise in execution risk?
This "Great Decoupling" suggests that the current equity rally may be becoming stretched, as credit participants signal that the cost of growth is no longer as "cheap" as the equity indices would suggest.
The "AI Arms Race" and Balance Sheet Degradation
To understand why credit markets are diverging from equity price action, one must look past the "top-line" AI growth narrative and examine the structural shift in how these companies are deploying capital. For the equity investor, massive capital expenditure (Capex) is often viewed as a "build it and they will come" bullish signal. For the credit analyst, however, it represents a definitive increase in the risk profile of the balance sheet.
From Asset-Light to Asset-Heavy
The mega-cap tech cohort earned its valuation premiums over the last decade by operating "asset-light" models with massive free cash flow (FCF) margins. The current "AI Arms Race" has fundamentally inverted this. We are witnessing a transition toward a high-intensity infrastructure model.
While the median S&P 500 company maintains a Capex-to-Revenue ratio of roughly 10%, the "hyperscalers" driving the current rally are frequently operating in the 30% to 50% range.
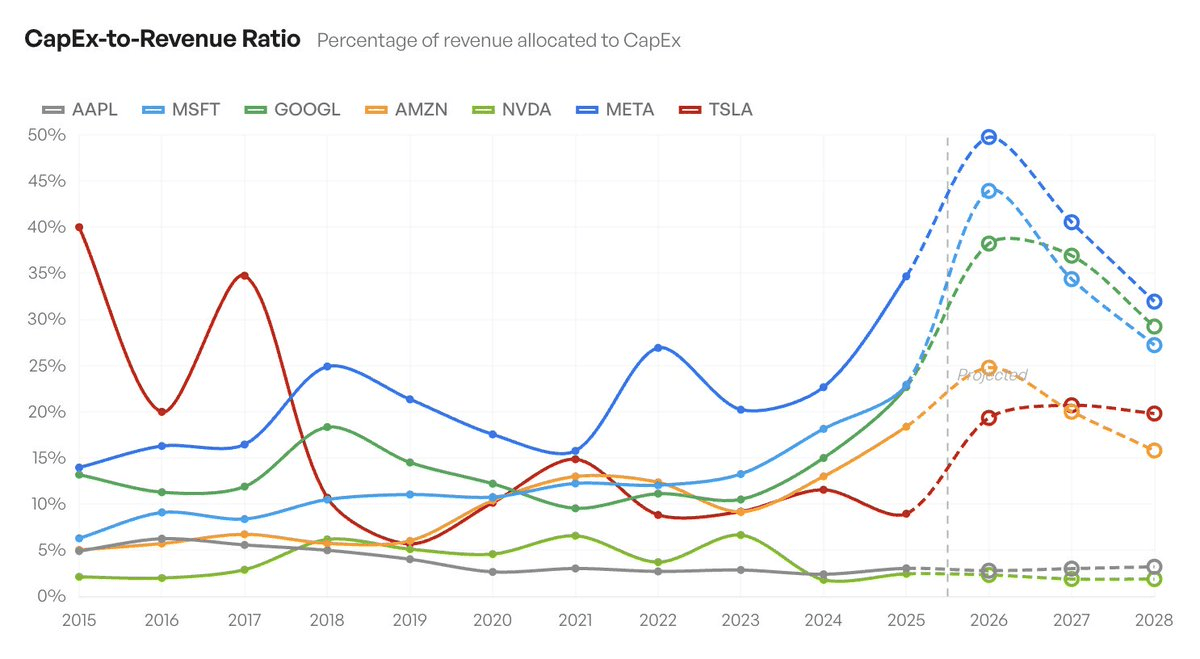
This pivot necessitates massive debt issuance or the depletion of cash reserves to fund the procurement of high-cost GPUs and the construction of specialized data centers. Credit Default Swap (CDS) participants are pricing in the "execution risk" of this spend—specifically, the possibility that the return on invested capital (ROIC) will not scale linearly with the debt incurred.
If you’re interested in reading about the barbell strategy we’ve proposed for these dynamics, you can read more about it in this blog post written earlier this year.
Margin Pressure vs. Multiples
While equity multiples have expanded on the expectation of future AI-driven efficiency, credit markets are focused on the immediate pressure on operating margins.
The first of these is the depreciation drags. As massive AI clusters come online, the associated depreciation and amortization (D&A) expenses will begin to hit the income statement. For credit investors, this raises the bar for interest coverage ratios.
Similarly, if the monetization of AI software lags behind the physical infrastructure build-out, these firms face a "liquidity gap." The widening 5-year CDS spreads we are observing suggest that credit desks are skeptical that these companies can maintain their fortress balance sheets while simultaneously out-spending their rivals in a race to achieve AGI (Artificial General Intelligence).
The "Higher-for-Longer" Floor
Finally, the credit market's lack of enthusiasm is tethered to the reality of the cost of capital. Even for firms with massive cash piles, the opportunity cost of deploying billions into hardware—rather than yielding risk-free rates in money markets or retiring existing debt—is significant.
When a stock like Meta or Oracle surges to new highs, the equity market is celebrating a perceived "land grab." Conversely, the CDS market is looking at the rising cost of insuring that same company’s debt over five years, noting that the "safety margin" for these firms is thinner than it was just two years ago. In this environment, credit is not just a lagging indicator; it is a fundamental reality check on the sustainability of the equity rally.
So Which Market Is Right?
When equities and credit decouple, it creates a "pre-crisis" or "pre-consolidation" tension that professional managers must navigate. Historically, credit is the "smart money"—the cold, calculating evaluator of a company’s ability to survive its own ambitions. Equities, by contrast, are the market of "hope," pricing in the best-possible-outcome for growth.
The Liquidity Argument: Is Credit Just "Slow"?
One could argue that the widening CDS spreads are simply "noise" caused by lower liquidity in the credit markets compared to the frenetic volume of the AI-driven equity surge. In this view, the equity market is the lead discovery mechanism, and credit will eventually tighten once the "new normal" of AI profitability is established. However, for a portfolio manager, treating credit as "lagging" is a dangerous game; credit volatility often precedes equity drawdowns because it reflects the cost of capital—the very oxygen the equity market breathes.
The Convergence Scenarios
How does this disconnect resolve? History suggests two primary paths:
The Rationalization (Bull Case): Equity strength is validated by subsequent earnings reports that are so strong they "de-lever" the balance sheet through sheer cash flow, forcing CDS spreads to tighten in a rapid catch-up move.
The Reality Check (Bear Case): The "Dispersion Trade" reaches its limit as mega-cap earnings conclude. As the implied correlation index (COR3M) begins to rise from its floor, the equity market "catches down" to the credit market's skepticism. The widening CDS spreads effectively acted as the "canary in the coal mine" for a return to systematic risk.
Tactical Takeaway: Position for Asymmetry
For the professional advisor, the current divergence suggests that the risk-reward for the "momentum long" has become heavily skewed. When the equity market is at a premium and the credit market is at a discount (relative to risk), the "pain trade" is no longer higher—it is a sharp unwinding of the dispersion trade.
Watch the DSPX/COR3M spread. If the dispersion index begins to collapse while CDS spreads remain wide, it is a signal that the "idiosyncratic" protection of single stocks is failing, and a broader, index-level correction is likely underway.
Turn Insight into Execution with Surmount Wealth
As we’ve analyzed, the disconnect between equity momentum and credit reality is more than a technical curiosity—it’s a call to action for precise risk management. But identifying a "CDS-Equity Divergence" or a "Dispersion Unwind" is only half the battle. The real alpha is found in the execution.
This is where Surmount Wealth changes the game for professional advisors and portfolio managers.
Don’t Just Track the Thesis—Automate It.
Whether you are looking to hedge against a tech-led reversal or capitalize on rising implied correlations, Surmount Wealth provides the infrastructure to move from "market view" to "automated strategy" in minutes.
Custom Strategy Builder: Use our no-code interface to build rules-based strategies that trigger based on the exact data points we discussed—credit spreads, dispersion indices, or specific volatility thresholds.
Pre-Built Institutional Models: Access a library of data-driven portfolios designed to navigate high-volatility environments and structural market shifts.
Broker-Agnostic Automation: Seamlessly connect to your existing custodians (like Interactive Brokers or Alpaca) to execute complex rebalancing and defensive measures without manual intervention.
Precision Risk Control: Set automated "circuit breakers" and trailing stops that monitor the market 24/7, ensuring your clients' capital is protected even when you’re away from the terminal.
Stop Reacting. Start Scaling.
The next market turn won't wait for your manual trade entry. In a world of "Agentic AI" and rapid-fire dispersion trades, manual portfolio management is a liability. Surmount Wealth allows you to scale your expertise, providing a personalized, software-driven experience that keeps you ahead of the curve.
Ready to see how your thesis looks in motion?
[Book a 1-on-1 Strategy Demo Now]
Experience the future of systematic wealth management and see how Surmount Wealth can automate your most complex investment ideas.