
Blog

Geopolitical Gamma: Hedging the "Iran Present" and Energy Infrastructure
For much of the last decade, professional managers have viewed geopolitical tension as a source of Geopolitical Beta—a persistent, underlying headwind or tailwind that influences broad market trends over months or years. However, recent pre-market surges seen in SPX and NDX futures, triggered by tweets from the President indicate shifting dynamics in Geopolitical Gamma.
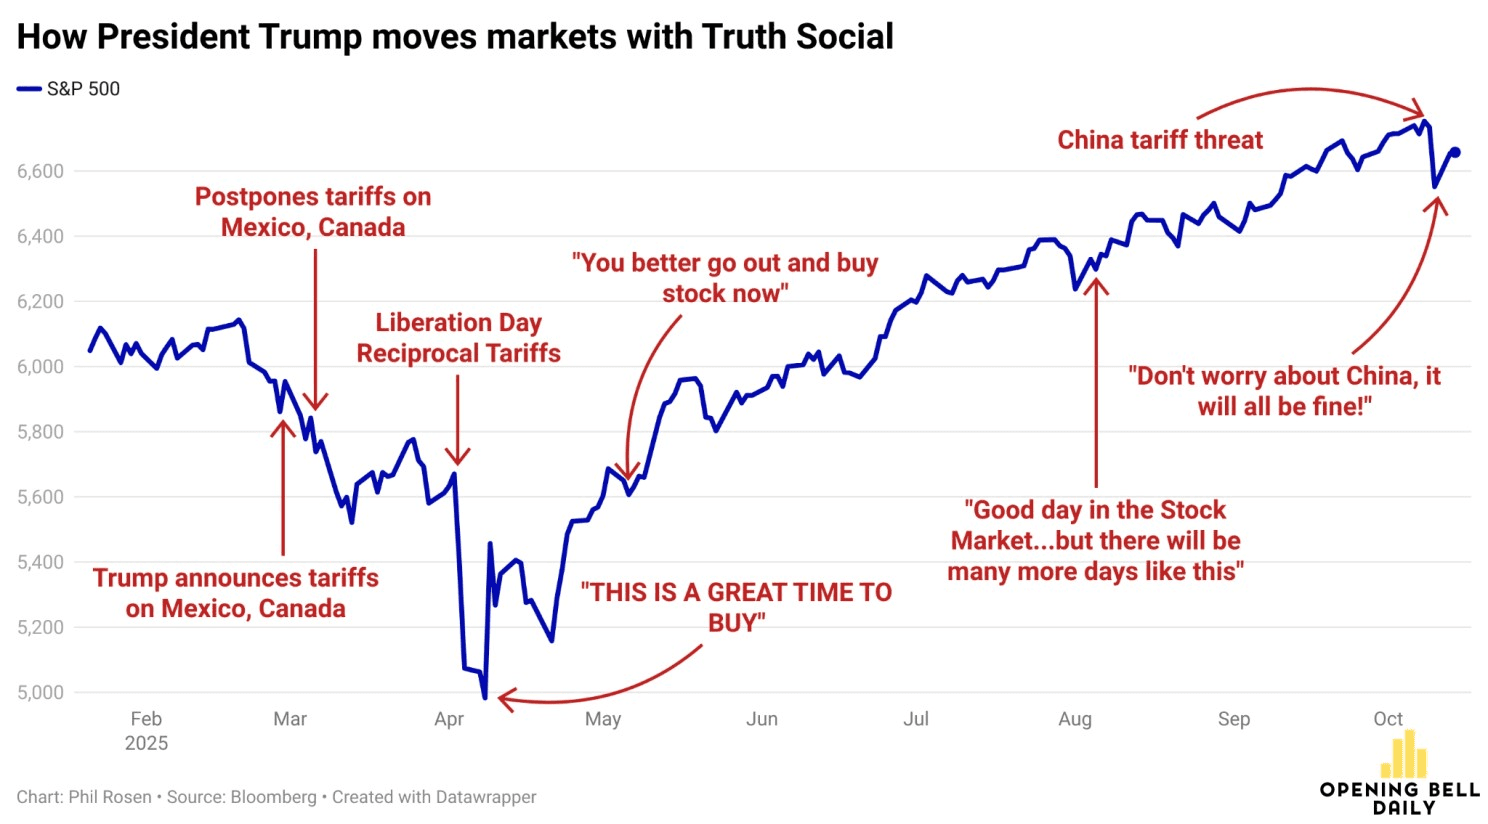
In a standard "Beta" environment, markets price in risk gradually as data points emerge. In a "Gamma" environment, the market's "Delta"—its sensitivity to price changes—shifts instantaneously. A single strategic pivot or diplomatic signal can flip a bearish trend into a massive short-covering rally before the cash market even opens. This creates a dangerous environment for managers relying on trailing stops or linear hedging models; when the SPX gaps 4% on a headline, the "exit" doesn't exist—only the "gap" does.
Defining the Gamma Risk
For the institutional portfolio, the risk is no longer just the magnitude of a drawdown, but the acceleration of that drawdown.
Linear Risk (Beta): A gradual 8-10% pullback (as seen in late January) allows for "orderly" rebalancing and rotation into defensives.
Non-Linear Risk (Gamma): A binary geopolitical outcome—such as the reopening of the Strait of Hormuz versus a "partial invasion" of Kharg Island—creates a convexity trap.
If the market "Trusts in Trump" for a deal, the resulting surge can blow out hedges; if the "present" from Iran fails to materialize, the subsequent "washout" below the 200-day moving average could trigger a cascade of systematic liquidations.
The Asymmetric Setup
As we analyze the current technical structure—marked by negative RSI divergences and a "Death Cross" looming over the Nasdaq—the introduction of a geopolitical wildcard makes traditional diversification insufficient. We must look at the market not as a series of earnings reports, but as a series of binary options.
In the following sections, we will move beyond "buying the dip" and explore how to manage this non-linear risk through convexity hedging and proxy trades.
The Mechanics of Convexity: Hedging Beyond "Buying the Dip"
In an "orderly" correction, standard diversification often suffices. However, when a market is pinned to the erratic nature of "Geopolitical Gamma"—where a single diplomatic "present" or a military escalation at Kharg Island can gap the futures market by 4% overnight—linear hedging is insufficient. To navigate this, practitioners must look toward convexity, or "long gamma" strategies, that thrive on volatility expansion.
The VIX Call: Capturing the Volatility Spike
While many retail advisors "buy the dip," institutional desks look to the VIX term structure. When the S&P 500 tests critical support levels like 6,300, the cost of equity puts often becomes prohibitive due to high implied volatility (IV).
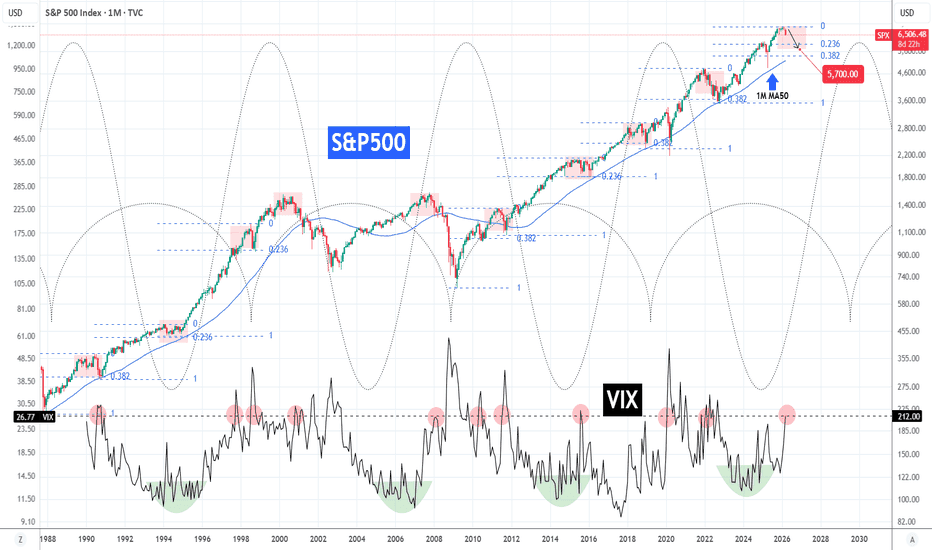
Instead, long OTM (Out-of-the-Money) VIX calls offer a convex profile. Because VIX tends to mean-revert violently upward during "washout" events, these options can provide a massive payout relative to the premium spent, effectively acting as a "fire insurance" policy that pays out more as the "fire" spreads.
Proxy Trades: Navigating the Strait of Hormuz
Sophisticated managers recognize that the Strait of Hormuz is the world's most important oil chokepoint. If the "partial invasion" scenario mentioned in the analysis manifests, the hedge isn't just "Short SPY"; it’s a targeted play on global logistics:
Tanker Rate Arbitrage (STNG, FRO): A blockade or conflict in the Strait forces longer shipping routes (the "ton-mile" effect). This creates a spike in spot rates for Crude and Product tankers. These equities often decouple from the broader SPX during energy crises, providing a rare green cell in a sea of red.
The Brent-WTI Spread: Middle Eastern instability disproportionately affects Brent crude. Trading the widening spread between Brent and WTI allows a manager to hedge geopolitical risk without taking a directional bet on global demand.
Tail-Risk Collars and Delta Neutrality
For portfolios heavy in "MAG" stocks (like the 60% drawdown seen in Oracle or 33% in Microsoft), the "Five-Step Plan" should involve Zero-Cost Collars. By selling OTM covered calls to fund the purchase of OTM puts, managers can "bracket" their risk.
It’s important to remember that, in a regime where the 50-day MA is nearing a "Death Cross," maintaining a Delta-Neutral posture through futures shorting is the preferred institutional method to "freeze" a portfolio’s value until the RSI confirms a capitulation bottom.
To write Section 3 for a professional audience, you need to move past the retail narrative of "high oil = bad" and focus on the cross-asset correlation regimes that portfolio managers use to determine risk-on versus risk-off positioning.
Here is a technical draft for Section 3: The Oil/SPX Correlation: Tax Cut vs. Deflationary Shock.
The Oil/SPX Correlation: Tax Cut vs. Deflationary Shock
In the current macro regime, the relationship between Crude Oil (WTI/Brent) and the S&P 500 has decoupled from its historical norms, creating a complex "convexity trap" for unhedged portfolios. Professional advisors must distinguish between oil as a cost-push inflation driver and oil as a signal for global liquidity.
1. The Shifting Correlation Coefficient
Historically, the Oil-SPX correlation oscillates based on the primary market concern: Inflation vs. Growth.
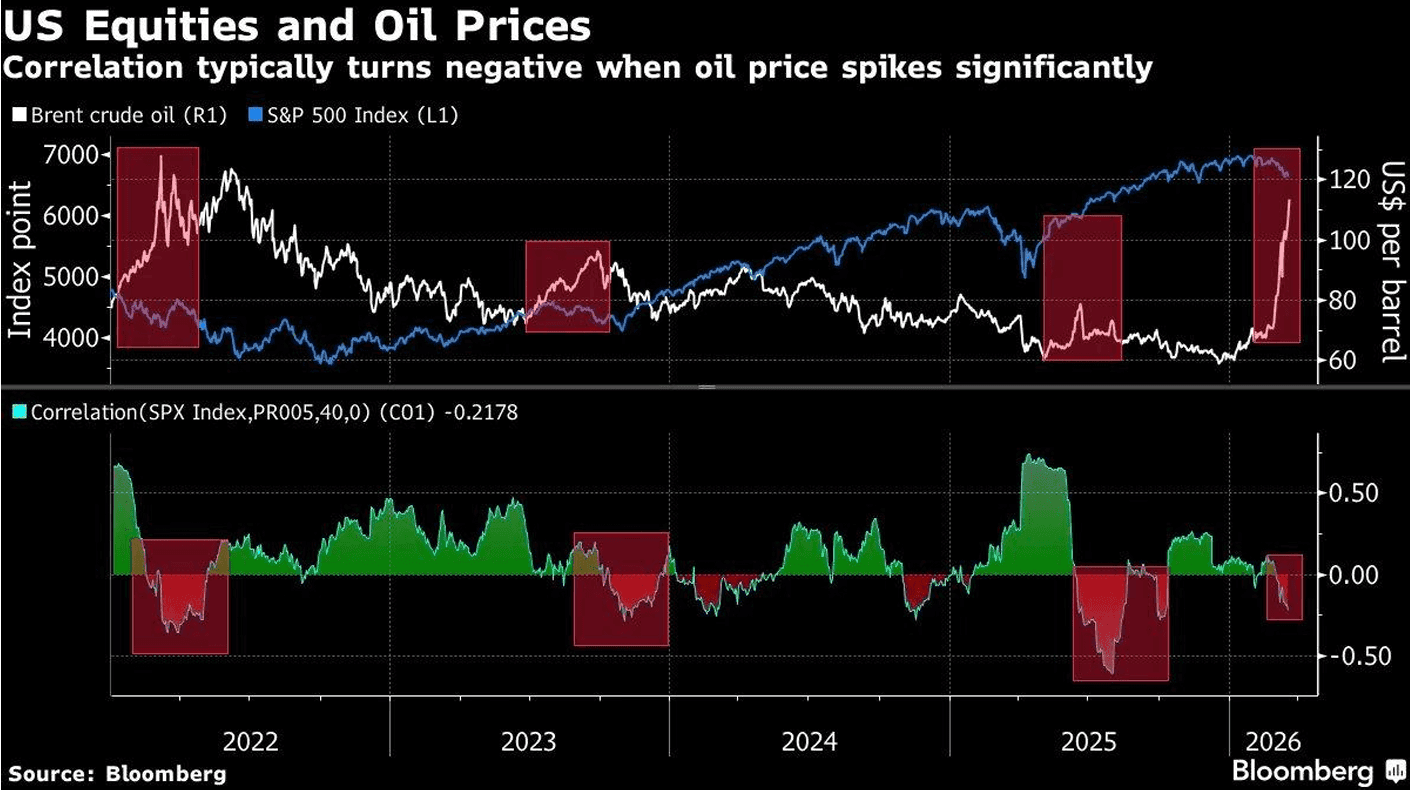
The "Tax Cut" Narrative (Negative Correlation): When oil craters due to a geopolitical "de-escalation" (e.g., the potential Iran deal), it acts as an immediate $300B+ stimulus to the U.S. consumer. For names like Amazon (AMZN) and Apple (AAPL), lower energy costs expand margins and discretionary spending power.
The "Deflationary Shock" Narrative (Positive Correlation): Conversely, if oil drops too fast, it signals a "liquidity vacuum." For the Energy (XLE) and Materials (XLB) sectors, a breach of the 200-day moving average in crude often precedes a broader "washout" in industrial equities, as seen in the recent 8% SPX pullback.
2. Sector Dispersion: Winners of the "Crater"
The current pullback has left several mega-tech names at "irrational" valuation resets. A collapse in energy prices provides the fundamental "air cover" for these stocks to mean-revert:
Consumer Discretionary/Logistics: Lower fuel surcharges directly benefit high-growth platforms with massive delivery footprints.
The "AI Infrastructure" Hedge: While NVDA and AMD are energy-intensive from a data-center perspective, their primary headwind is the "Hawkish Fed." Lower oil provides the Fed with the "disinflationary" evidence needed to swing the rate-cut pendulum back toward September.
3. The "Transitory" Trap and Fed Policy
Jerome Powell’s recent hesitation to use the "T-word" regarding energy prices suggests a Fed that is "Geopolitically Reactive" rather than proactive.
The Policy Pivot: If oil stabilizes in the $60-$70 range, the "Inflationary Impulse" from the Middle East evaporates. For portfolio managers, this shifts the "Path of Least Resistance" for the SPX from a test of the 6,000 support level back toward the 7,800 year-end target.
Technical Confirmation: Watch for a "Capitulation Bottom" where oil volatility (OVX) spikes while the SPX recovers its 200-DMA. This "Inverse Volatility Breakout" is often the strongest signal that the correctional phase has ended.
From Thesis to Execution with Surmount Wealth
The difference between a successful portfolio manager and a sidelined spectator isn't just the quality of the analysis—it’s the speed and precision of the execution. As we’ve discussed, "Geopolitical Gamma" moves faster than any human trader can click "Sell." If your strategy relies on being at your terminal when a tweet drops or a moving average is breached, you are already behind the curve.
This is where Surmount Wealth changes the game.
Whether you are looking to capitalize on the "Orderly Correction" washout or build a Convexity Hedge against the next Strait of Hormuz disruption, Surmount provides the institutional-grade infrastructure to turn high-level macro theses into 24/7 automated realities.
Why Systematic Advisors Choose Surmount:
Automate Any Thesis: Don't just watch the RSI hit 30 or the 200-DMA break; program Surmount to execute your exact "Five-Step Correction Plan" the millisecond your parameters are met.
Prebuilt Institutional Strategies: Gain immediate access to a library of battle-tested, automated strategies designed for high-volatility regimes.
Custom Strategy Engine: Work with our team to build bespoke, algorithmic models tailored to your specific risk tolerance and "MAG" stock valuation resets.
Remove the "Human Alpha" Leak: Eliminate the emotional hesitation of "buying the dip" during a panic. Our platform ensures your dry powder is deployed exactly when the technicals—not your nerves—say it’s time.
The market doesn't wait for your morning meeting. In a regime defined by 4% pre-market surges and "Iran Presents," automation isn't a luxury—it’s a fiduciary necessity.
[Book a Demo with Surmount Wealth Now]
See how our automated strategies can shield your AUM and capture the next regime shift while you sleep.
Related


Get Started
Experience the full power of our SaaS platform with a risk-free trial. Join countless businesses who have already transformed their operations. No credit card required.

FAQs
How can this impact my business?
How long does an this take to implement?
Will we need to make changes in our teams?

Still have a question?
Get in touch with our team.

