
Blog

Oil Price Shocks: Stress-Testing Client Portfolios for a $120 Scenario
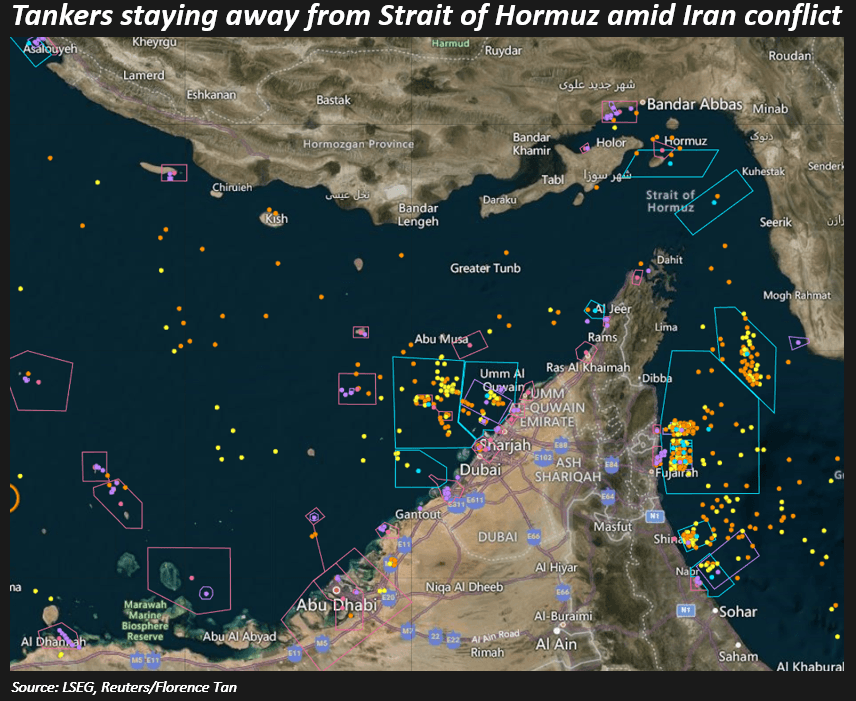
Following the rapidly expanding escalations in the Middle East, with US-Israel joint strikes on Iran, culminating in the confirmed death of the regime's top leadership, including Supreme Leader Ayatollah Ali Khamenei, Iran has subsequently responded with a full-scale regional kinetic engagement. GCC states like the UAE, Saudi Arabia, and Qatar have seen direct missile and drone impacts on critical infrastructure, including the Jebel Ali port and various energy hubs.
With the Hormuz Chokepoint now effectively impassable due to a combination of IRGC kinetic threats and the mass withdrawal of maritime insurance coverage, the oil market has effectively entered a "Price Discovery" vacuum. Standard fundamental modeling has been rendered obsolete by the sudden physical removal of 20 million barrels per day (mb/d) of crude and 20% of global LNG supply.
JP Morgan actually projects that, in a scenario where the Strait of Hormuz remains fully obstructed for more than 25 days, Middle Eastern producers will exhaust all available onshore and floating storage. At that saturation point, a forced "shut-in" of production becomes inevitable, potentially catapulting Brent into the $120–$150 range as the market grapples with a structural deficit that no Strategic Petroleum Reserve (SPR) release can fully offset.
For portfolio managers, this systematic risk event is very critical to address. When 20% of the world's oil is at stake, the discount rate for every future cash flow on your terminal must be reassessed.
Equities: Mapping the Dispersion Between Cost-Push and Revenue-Pull
Typically, when Brent crude targets $120, the equity portion of any portfolio ceases to trade as a monolith. The primary driver of performance becomes the tension between Input Cost Inflation (the "Push") and Pricing Power (the "Pull"). To stress-test this, we categorize the sleeve into three distinct buckets:
1. The Direct Beneficiaries: Revenue-Pull Alpha
For the Energy sector, $120 oil represents a massive expansion of free cash flow (FCF) yields. However, the stress test should look deeper than the "Supermajors."
Upstream E&P: Focus on operators with low lifting costs and unhedged production. At $120, these firms transition from "surviving" to "capital return machines" (buybacks and special dividends).
The Service Tail: Don’t overlook Oilfield Services (OFS). As producers scramble to increase capacity in a high-price environment, OFS firms gain significant utilization and day-rate leverage.
Energy-Adjacent Defense: Given the Iranian context, Aerospace and Defense equities often act as a secondary "geopolitical hedge," capturing the increased budgetary flows toward regional security.
2. The Vulnerable Middle: The Cost-Push Squeeze
This is where the most significant portfolio damage occurs. Advisors must quantify the “Energy Intensity” of their holdings.
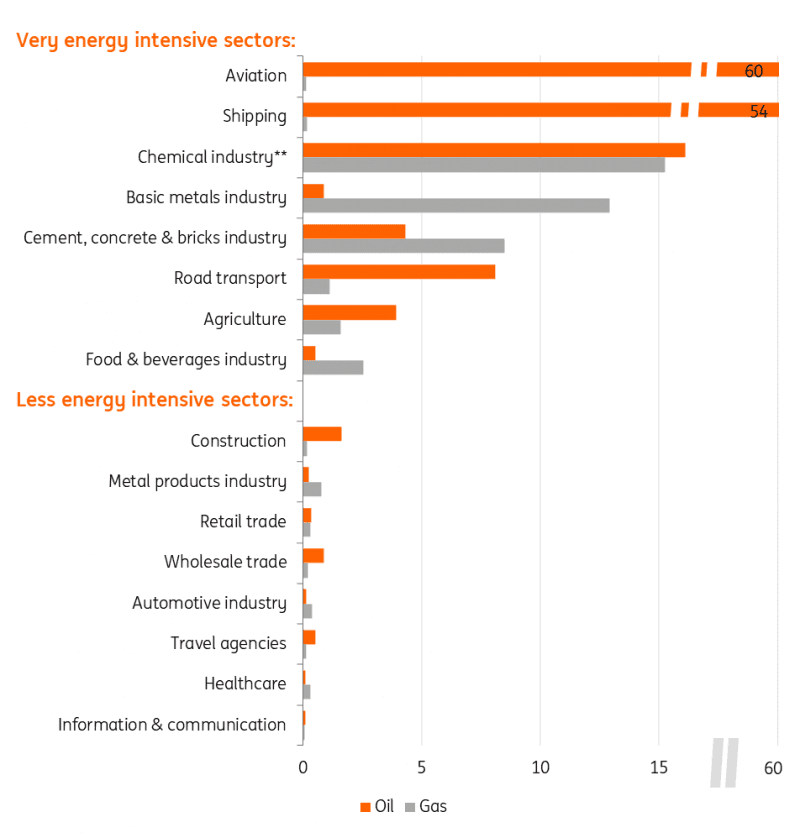
Consumer Discretionary: $120 oil acts as a regressive tax on the consumer. Stress-test your exposure to "Experience-based" discretionary spend (Cruises, Theme Parks, Mid-tier Retail) which suffers from both higher fuel surcharges and lower consumer "wallet share."
Industrial Feedstocks: Chemicals and Steel producers are hit twice: once by the energy required for heat/power, and again by the rising cost of petroleum-based raw materials.
Transportation & Logistics: Airlines and trucking firms with weak hedging books will see immediate margin evaporation. The "winners" here are those with surcharge flexibility—those who can pass the buck to the customer within 30 days.
3. The Deflationary "Quality" Safe Harbors
When the energy shock threatens to tip the economy into a recession, the market shifts toward Quality and Low-Vol factors.
Tech & Software: While sensitive to the discount rates (valuation risk), large-cap software-as-a-service (SaaS) companies have negligible direct energy inputs. Their margins remain largely insulated from the physical cost of a barrel.
Healthcare: Historically, Healthcare shows a low correlation to energy price spikes, providing a defensive "ballast" when the broader S&P 500 experiences volatility.
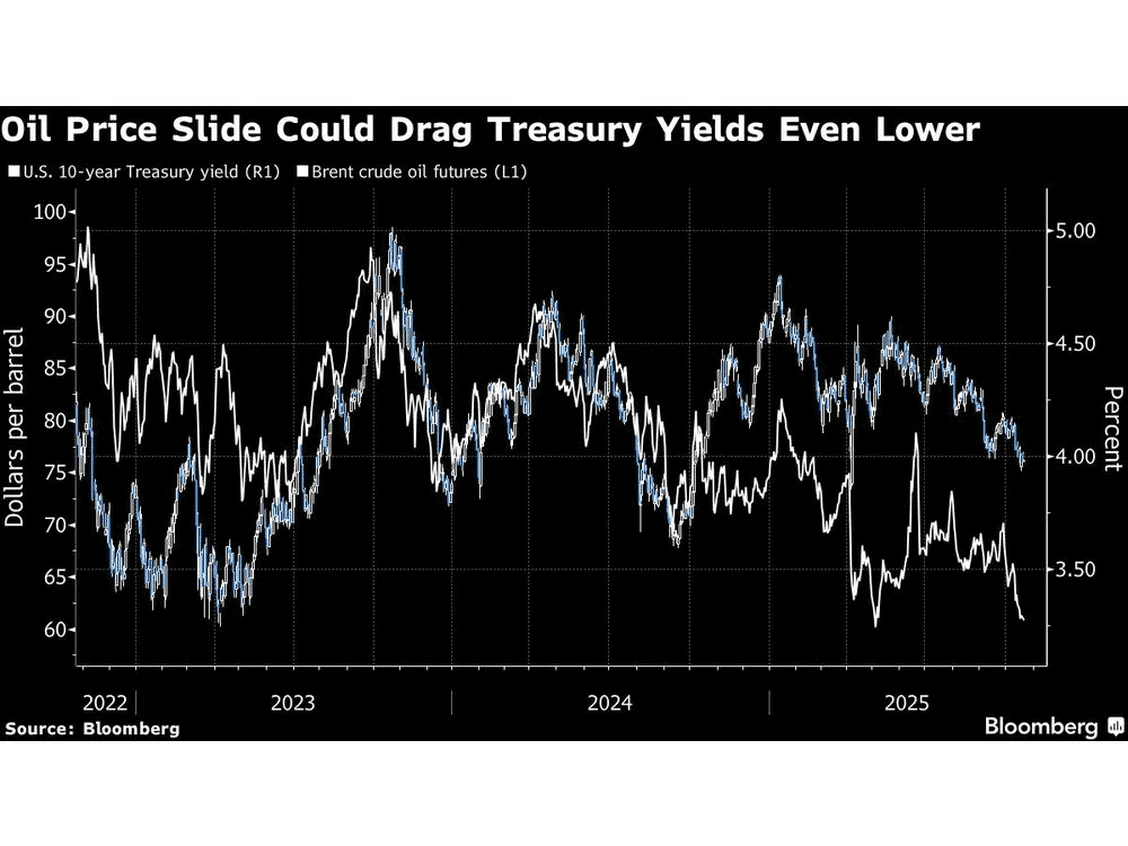
Fixed Income – The Inflation Breakeven & Duration Trap
Investors that lean increasingly towards fixed income portfolios often view the asset class as a "safe harbor" during geopolitical unrest. However, an oil price shock could potentially flip the traditional script, turning high-grade bonds from a hedge into a primary source of risk—specifically via the Duration Trap.
In this environment, the portfolio manager must navigate the tension between rising nominal yields (driven by inflation expectations) and the potential for a "flight to quality" if the energy shock triggers a global recession.
A spike in Brent prices creates immediate upward pressure on headline CPI. For the fixed income sleeve, the first line of defense is the Breakeven Inflation Rate.
TIPS vs. Nominals:
At peak oil prices, nominal Treasuries are likely to see their real yields eroded. As such, shifting toward Treasury Inflation-Protected Securities (TIPS), which historically outperform when actual inflation outpaces the "priced-in" expectations, could be a smart hedging
The Cost-Push Reality:
Advisors must communicate to clients that this isn't "demand-pull" inflation (which signals a healthy economy) but "cost-push" inflation—a scenario where the Fed/Central Banks may be forced to keep rates "higher for longer" despite slowing growth.
Escaping the Duration Trap:
Duration is your greatest enemy when energy costs act as a persistent tailwind for yields.
The Parallel Shift Risk: A sustained elevated price floor can cause a parallel shift upward in the yield curve. For a portfolio with a duration of 7 years, a 100-basis-point move in response to sticky energy inflation results in a -7% capital loss, potentially wiping out two years of coupon income.
Tactical Shortening: A tactical migration toward the "belly" of the curve (2–5 years) or increasing exposure to Floating Rate Notes (FRNs) are the smartest options to play this. FRNs offer a hedge against a hawkish central bank response to energy-driven inflation spikes.
Credit Spread Sensitivity: The Bifurcation
Not all credit is created equal in a $120 scenario. PMs must perform a "bottom-up" audit of energy inputs across the credit book.
A High Yield energy situation is a silver lining. Many HY energy issuers see massive free cash flow generation at $120 oil, leading to potential credit upgrades (the "Rising Star" effect).
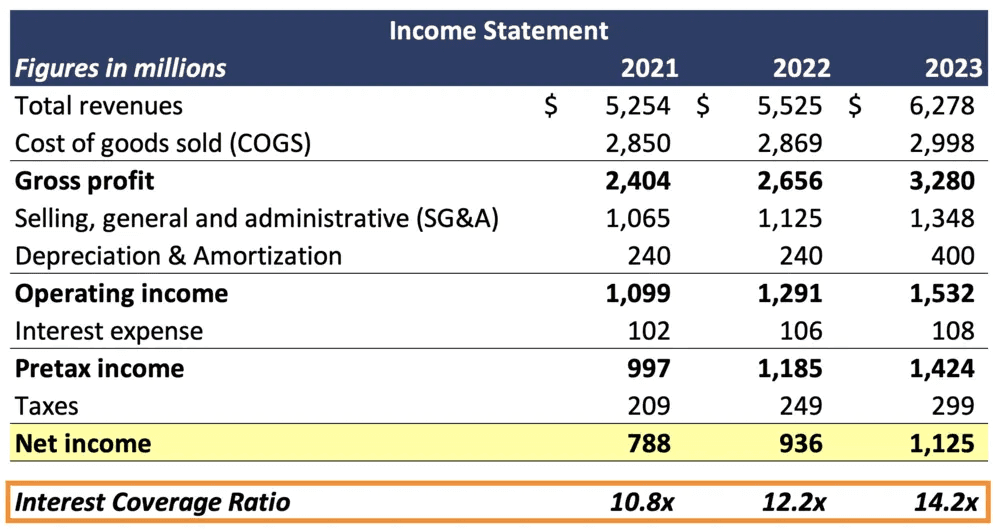
Conversely, investment-grade (IG) issuers in the consumer staples or industrial sectors may see their Interest Coverage Ratios tighten as energy-driven OpEx eats into the cash flow meant for debt service.
Alternatives – Real Assets and the Liquidity Premium
In an elevated oil price environment, the "Alternative" sleeve of a portfolio becomes critical, especially as an inflation hedge. However, for the Portfolio Manager, the primary risk here isn't just price volatility—it’s the Liquidity Premium and the divergence in operational overhead.
Here is how to best model these exposures:
1. Real Assets: The Operational Cost-Push Model
Unlike equities, real assets have high physical carrying costs. When modeling $120 oil, you must bifurcate assets by their ability to pass through energy costs.
Infrastructure (Core vs. Value-Add):
Run a sensitivity analysis on Unhedged Power Costs. For data centers and cold-storage logistics, energy can represent 30-50% of OpEx. Look for "Triple Net" (NNN) structures where the tenant bears the energy risk, or infrastructure with inflation-linked regulatory resets.
Real Estate (CRE):
Evaluate the Energy Performance Certificate (EPC) ratings of the portfolio. In a high-oil scenario, "Brown Discounts" accelerate as inefficient buildings become prohibitively expensive to climate-control, leading to lower Net Operating Income (NOI).
Overall, a granular asset portfolio may be worth considering.
2. Private Markets & The "Denominator Effect"
An abnormal spike in oil prices often triggers a sell-off in liquid benchmarks (S&P 500/Agg), while private marks remain stale. This creates a functional "Liquidity Trap."
Rebalancing Risk: Model the Denominator Effect. If public equities drop 15% due to an energy shock while Private Equity marks remain flat, your Alts allocation may breach its policy maximum, forcing a "fire sale" of liquid assets to rebalance.
Private Credit Coverage: Conduct a "Sensitivity Stress" on the Interest Coverage Ratio (ICR) of mid-market borrowers. A simultaneous rise in energy inputs and potential rate hikes to combat energy-led inflation can squeeze EBITDA margins to the point of technical default.
3. Strategic Commodities & Managed Futures (CTAs)
At extreme oil prices, the correlation between traditional assets and trend-following strategies usually decouples, providing a "Crisis Alpha."
Trend Following: Model the performance of CTAs (Commodity Trading Advisors). These strategies thrive on the "velocity" of a price move. If oil moves from $80 to $120 in a 30-day window, trend-followers typically capture the bulk of the "long" convexity.
The Contango/Backwardation Factor: Check the "Roll Yield." In a supply-shock scenario (Iran/Strait of Hormuz), the oil market typically enters deep Backwardation (spot prices > future prices). This provides a positive roll yield for commodity-heavy Alts, effectively paying the client to hold the hedge.
Takeaway: Agility Over Inertia
In a market defined by geopolitical volatility, the greatest risk isn’t the price of oil—it’s the latency of your response. Manual rebalancing and discretionary "wait-and-see" approaches are often too slow to capture the rapid divergence between energy-sensitive sectors and the broader market.
As the $120 oil scenario shifts from a tail risk to a base case, static portfolios face the threat of significant drawdown. This is precisely where Automated Surmount Strategies provide a structural advantage.
Why Automated Strategies Win in High-Volatility Regimes:
Systematic Alpha Capture: While human emotion might hesitate during a spike, an automated strategy executes on pre-defined triggers—reallocating from energy-heavy "cost centers" to "revenue beneficiaries" in milliseconds.
Dynamic Risk Parity: Surmount strategies can automatically adjust position sizing based on real-time volatility (VIX) and correlation shifts, ensuring that a spike in energy doesn't over-leverage your risk budget.
Hedging at Scale: Seamlessly integrate inverse ETFs or commodity overlays the moment specific price floors are breached, protecting client capital without requiring a 2:00 AM emergency committee meeting.
Modernize Your Risk Management
Don't let your clients' portfolios be a hostage to the next headline. Transition from reactive management to proactive, algorithmic resilience.
[Book a Demo with Surmount Today]
See how our automated strategies can stress-test your current holdings and implement a systematic "Energy Shock" playbook in real-time.
Related


Get Started
Experience the full power of our SaaS platform with a risk-free trial. Join countless businesses who have already transformed their operations. No credit card required.

FAQs
How can this impact my business?
How long does an this take to implement?
Will we need to make changes in our teams?

Still have a question?
Get in touch with our team.

