
Blog

Short-Covering Rallies in Bear Markets: How to Tell the Difference from a Real Recovery
There is a particular cruelty to bear markets that even seasoned portfolio managers fall victim to. This is, of course, the violent, convincing rally that appears precisely when sentiment is most damaged. Indices surge 5%, 8%, sometimes 10% in a matter of days. Headlines shift. The narrative pivots. And just as capital starts rotating back into risk, the market rolls over and makes new lows.
This is the short-covering rally — and confusing it with a genuine recovery is among the most consequential mistakes a professional investor can make.
The trap works because the mechanics of a short-covering rally produce price action that is, on the surface, indistinguishable from the early stages of a real bull market. Stocks rise sharply. Momentum indicators flip positive. Risk appetite metrics improve. The move feels like a change in regime. But underneath the surface, the driver is not actually new conviction entering the market — it is old conviction being forcibly removed from it.
In a bear market, re-entering risk during a short-covering rally means buying exposure just before the next drawdown leg, often at elevated prices, with sentiment already partially repaired. The cost of getting this wrong is the erosion of client trust at exactly the moment when steady, analytical judgment is most valuable.
The Mechanics: What Actually Drives Each Type of Rally
To distinguish between these two rally types, you need to understand what is generating the buying pressure in each case.
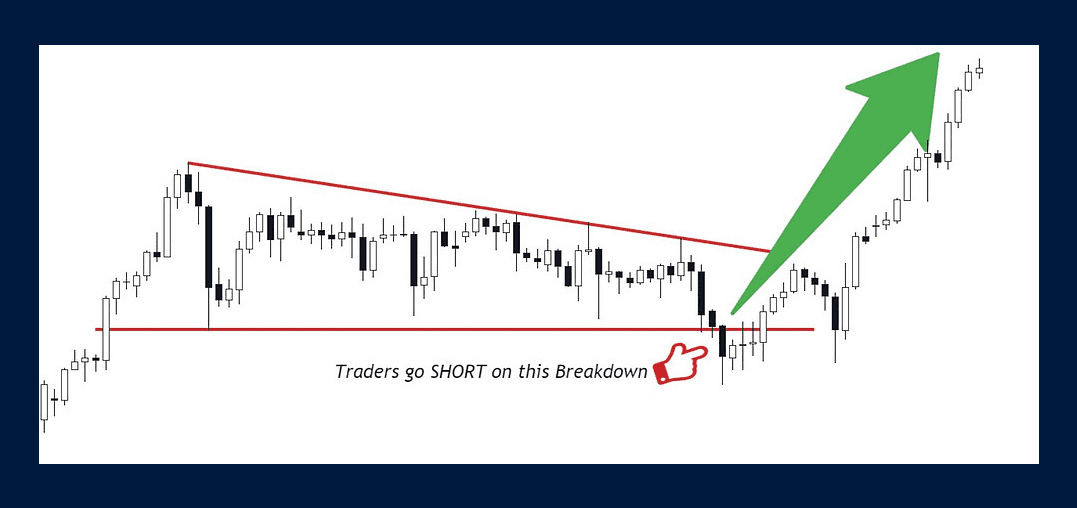
Short-covering rallies are supply-driven events.
When a market sells off sharply — often triggered by a macro shock, a geopolitical event, or a sudden deterioration in the data — short interest builds rapidly as bearish positioning becomes consensus. At some point, a catalyst (a policy statement, a ceasefire rumor, a slightly better-than-feared data print) causes the weakest short positions to cover. This creates a surge of forced buying that has nothing to do with improving fundamentals. It is mechanical, not fundamental.
The characteristics of this type of rally are fairly consistent. The move tends to be fast and steep, often recovering a significant portion of the preceding decline in just a few sessions.
Volume is elevated early but fades as the rally extends. Breadth is often narrow — a handful of the most heavily shorted sectors or names lead the move disproportionately, while defensive positioning holds up rather than rotating out. Critically, there is no underlying shift in the earnings revision cycle; analysts are not upgrading estimates, they are simply pausing downgrades.
Genuine recoveries are demand-driven events.
They look different from the start. New capital enters the market — institutional allocators increasing risk exposure, not short sellers reluctantly covering.
Breadth is broad and sustained, with cyclicals, financials, and small caps participating meaningfully rather than a narrow set of beaten-down names doing all the work. Volume builds rather than fades as the rally matures. Most importantly, the fundamental backdrop begins to stabilize: leading indicators stop deteriorating, earnings revisions flatten and eventually turn, and credit spreads — which often lead equity recoveries — begin compressing from a place of genuine risk appetite rather than short squeeze dynamics.
The options market is another useful lens. During short-covering rallies, implied volatility often drops sharply as short-dated put protection gets unwound alongside the short book. But the term structure of volatility rarely normalizes the way it does in genuine recoveries — longer-dated uncertainty remains elevated because the macro overhang has not actually cleared.
History is instructive here. The 2008 bear market produced at least four rallies exceeding 10% before the ultimate bottom in March 2009.
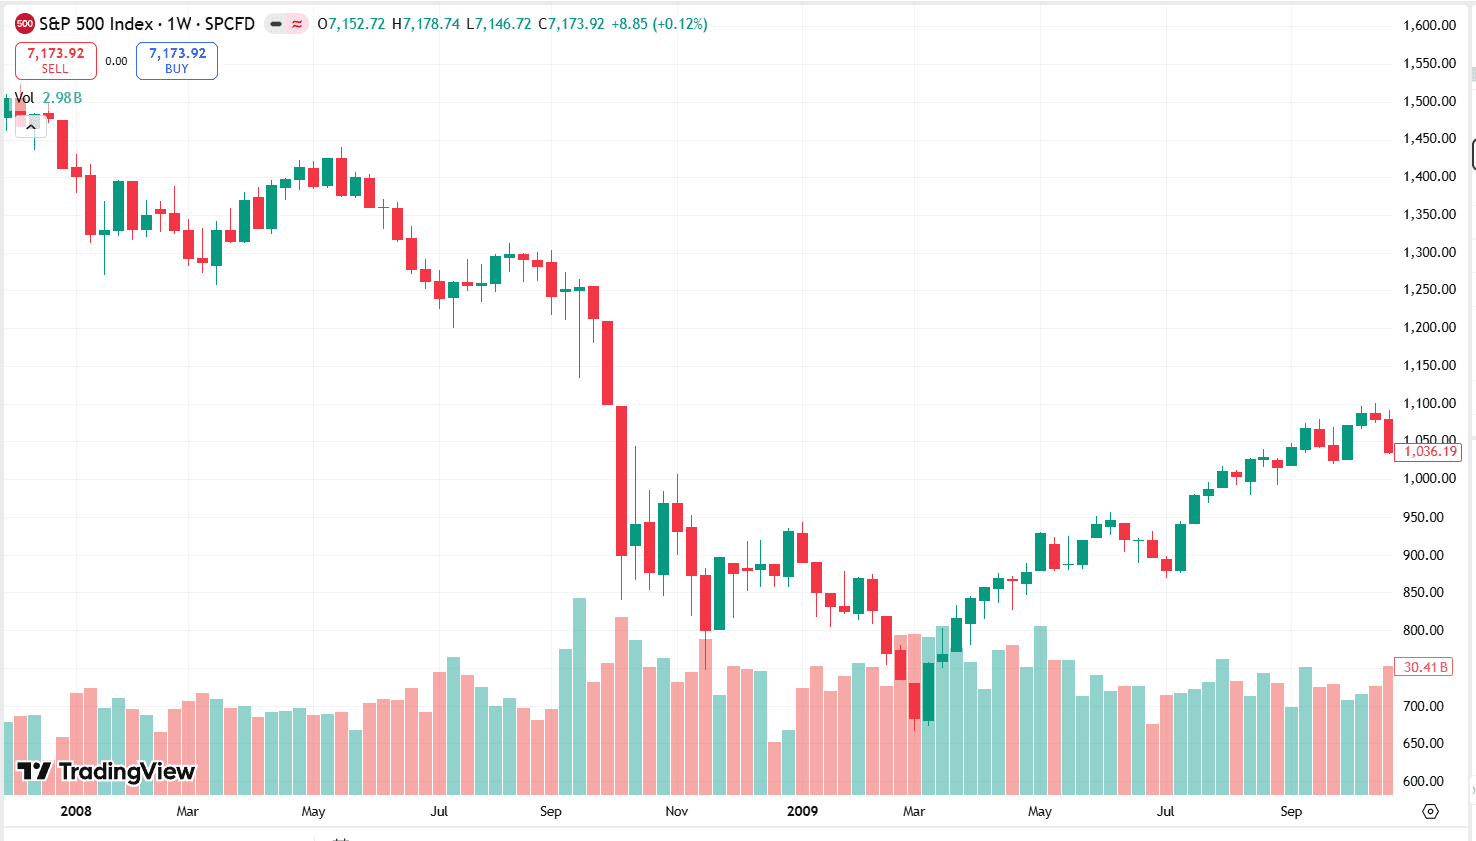
Each one had the hallmarks of short-covering: fast, narrow, volume that faded, no fundamental support. Each one was followed by new lows. Investors who treated any of those rallies as the start of a new cycle paid dearly. The same pattern played out across the dot-com unwind of 2000 to 2002. Bear markets do not end in a single sharp reversal — they end in exhaustion, with a base that builds over weeks or months, accompanied by improving data and a credible reason for the earnings cycle to turn.
The current environment offers its own diagnostic challenge. When a macro trigger — an energy supply shock, a geopolitical closure with no near-term resolution, the early signals of a stagflationary regime — remains structurally unresolved, any rally that occurs before that trigger clears deserves deep skepticism. A semiconductor-led bounce in the context of a closed Strait of Hormuz and deteriorating PMI data is a signal worth interrogating, not celebrating.
A Practical Framework: Positioning When Certainty Is Not an Option
The honest reality of bear market navigation is that no indicator is definitive in real time. You will never have perfect clarity on whether a given rally is short-covering or genuine recovery while you are inside it. The goal, therefore, is not perfect classification — it is avoiding catastrophic positioning errors when the signal is ambiguous.
A practical framework for professional managers involves three disciplines.
Anchoring to the macro trigger.
Before adjusting risk exposure during a rally, ask whether the primary macro catalyst driving the bear has been resolved, or simply paused. Rallies that occur with the fundamental trigger still active deserve a higher burden of proof before being acted upon. Price action alone — however sharp — is insufficient evidence that the regime has changed.
Using a multi-factor checklist rather than a single indicator
No single metric tells the whole story, but a checklist of breadth, volume, credit spreads, earnings revision direction, options term structure, and sector rotation patterns in combination provides a much more reliable read than price alone. If five of seven indicators are consistent with short-covering, the burden of proof for adding risk should be high.
Managing sizing rather than trying to call the exact turn
The most common error in bear markets is binary positioning — fully out, then fully back in. A more robust approach is to define the conditions under which you would incrementally increase exposure, and execute in tranches as those conditions are met. This preserves optionality, limits the cost of being early, and keeps you positioned to participate if the rally does in fact prove genuine. Hedging the incremental exposure with defined-risk structures — put spreads, collar strategies — allows for participation without catastrophic downside if the read is wrong.
The managers who navigate bear markets most effectively are rarely the ones who called the bottom precisely. They are the ones who avoided the expensive re-entries, preserved dry powder through the short-covering traps, and were positioned to buy duration and risk assets when the fundamental picture actually began to clear.
In a bear market, patience is not passivity. It is an active, disciplined choice to demand more evidence than the market is currently offering.
We also recommend a ‘wait and see framework’, which we earlier wrote about here.
Automate Your Bear Market Thesis with Surmount Wealth
Reading the macro environment correctly is only half the battle. The other half is executing with discipline — without letting short-term price action, client pressure, or cognitive bias override your framework in real time.
That is exactly what Surmount Wealth is built for.
Surmount's platform allows investment professionals to build and deploy automated trade strategies — either from a library of prebuilt strategies or fully customized to reflect your own macro thesis. Once your framework is defined, the strategy executes it systematically, removing the emotional friction that causes even well-reasoned views to break down at the moment of execution.
To illustrate the point, consider a hypothetical strategy designed around the current macro dynamics discussed in this piece — call it a "Stagflation Rotation Strategy." (Note: this is a hypothetical example for illustrative purposes only, not a live strategy or investment recommendation.)
Such a strategy might systematically rotate away from long-duration growth equities and rate-sensitive sectors as inflation signals breach defined thresholds, while increasing exposure to energy, short-duration fixed income, and commodity-linked assets. It could include rules-based hedging triggers — activating put protection on major indices when breadth metrics and PMI divergences reach levels consistent with short-covering rather than genuine recovery. The strategy would execute the framework every time, without hesitation, without second-guessing the latest headline.
That is the power of systematic execution built on a sound thesis.
Whether you want to deploy a prebuilt strategy or work with Surmount to automate your own proprietary framework, the platform is designed to meet you where your thinking is.
Book a demo with Surmount Wealth today and see how your macro thesis can be turned into a disciplined, automated strategy that executes with the consistency your clients deserve.


