
Blog

The Investor’s Dilemma: Even Great Businesses Can Be Awful Investments
The "Quality Factor" has essentially become a sanctuary for the modern portfolio manager. This is understandably so, of course, as we are trained to seek out wide moats, high returns on invested capital (ROIC), and pristine balance sheets. The prevailing wisdom suggests that if you "buy a great business and wait," the entry price eventually becomes a footnote. However, historical longitudinal data on S&P 500 valuations actually suggests that operational excellence is not a hedge against valuation risk; but it is often the catalyst for it.
The central challenge in professional advisory is the Paradox of Quality. This occurs when a business performs exactly as expected—growing market share, maintaining margins, and compounding earnings—yet the stock becomes a poor investment because the terminal value was fully discounted years in advance. In these scenarios, the stock doesn't need a "black swan" event to underperform; it simply needs to contend with the laws of mathematical gravity.
The Psychological Barrier: "Safety" vs. "Returns"
There is a profound professional risk (often called "career risk") associated with issuing a sell rating on a beloved compounder. If you sell a high-quality name and it continues to melt up for another 18 months, you look out of touch. But if you hold it through a period of multiple compression, you have succumbed to a sort of safety bias.
We must distinguish between two types of risk:
Business Risk: The probability that the company’s fundamentals will deteriorate.
Valuation Risk: The probability that you have paid so much for those fundamentals that your forward CAGR is capped near zero (or less) in real terms.
The Opportunity Cost Framework
To navigate this trap, we have to stop viewing "sells" as a critique of management. Instead, we must view them through the lens of Benchmarking Opportunity Cost.
If a high-quality business is trading at a multiple that implies a 3% forward earnings yield, while the Equal-Weight S&P 500 offers a more robust earnings yield with similar aggregate growth, the "Good Business" has become a structural drag on the portfolio.
According to historical data from 2019, 81% of full cycle sells, among high-quality names underperformed the equal-weighted index over the following six years. They didn't fail as businesses; they failed as vehicles for capital appreciation.
Using the "Full-Cycle" Filter to Define the Exit
For the professional manager, the decision to exit a position isn't about losing faith in the company's product; it’s about acknowledging that the equity's price has decoupled from its fundamental earnings power.
The "Full-Cycle" filter acts as a cooling mechanism, removing the heat of market sentiment to reveal the mathematical reality of forward returns.
The Yield Spread: Measuring the "Value Leak"
The most immediate quantitative signal for an exit is a compressed Starting Earnings Yield. When a high-quality business is bid up to an extreme multiple, the yield an investor "buys" becomes dangerously low.
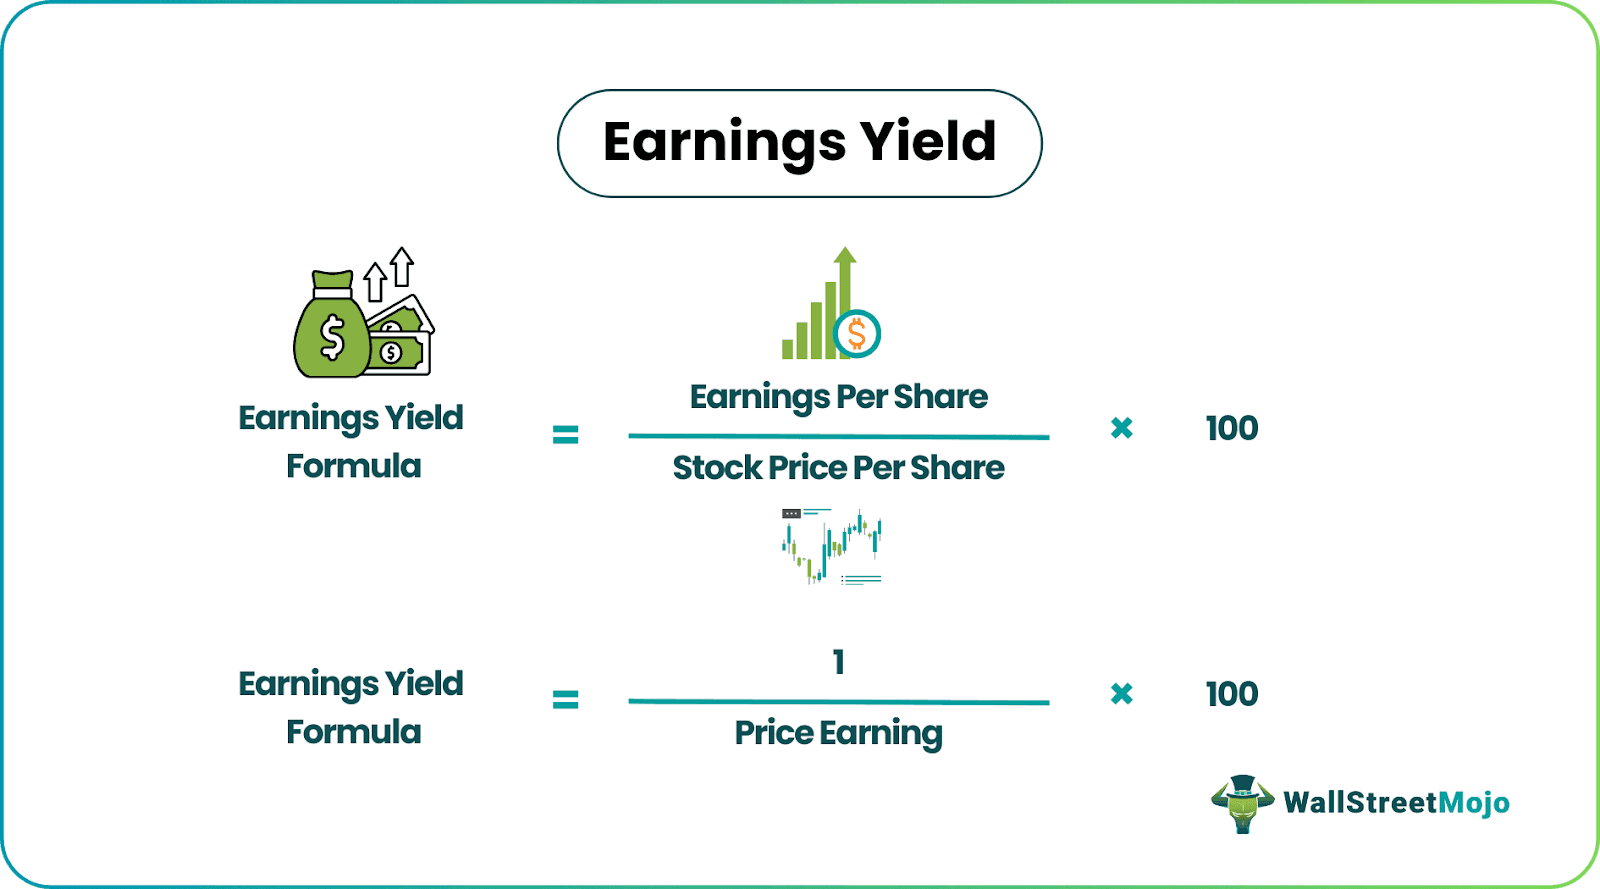
For example, if a "compounder" is trading at a 50x P/E, it offers a 2% earnings yield.
In a post-ZIRP environment where the risk-free rate or high-grade credit might offer 4-5%, that 200 basis point deficit represents a "Value Leak." Unless that company can grow earnings at an improbable, sustained rate to close the gap, the stock is structurally positioned for underperformance.
Factoring in the "Downcycle Drag"
Professional analysts often make the mistake of linear forecasting—projecting a straight line of 10-15% growth based on the last three years of "Goldilocks" conditions. The Full-Cycle Analysis demands a "stress-test" approach:
Historical Recapture: You must look back at least 10 years to see how the "algorithm" of the business performed during a true contraction (e.g., 2008 or 2020).
The Normalized Growth Rate: If a company historically sees earnings drop by 30% in a recession, that drawdown must be averaged into the long-term growth expectation.
The Exit Trigger: If the sum of the Starting Earnings Yield and the Normalized Growth Rate (inclusive of downcycles) is significantly lower than the expected return of the Equal-Weight S&P 500, the opportunity cost of holding has become too high.
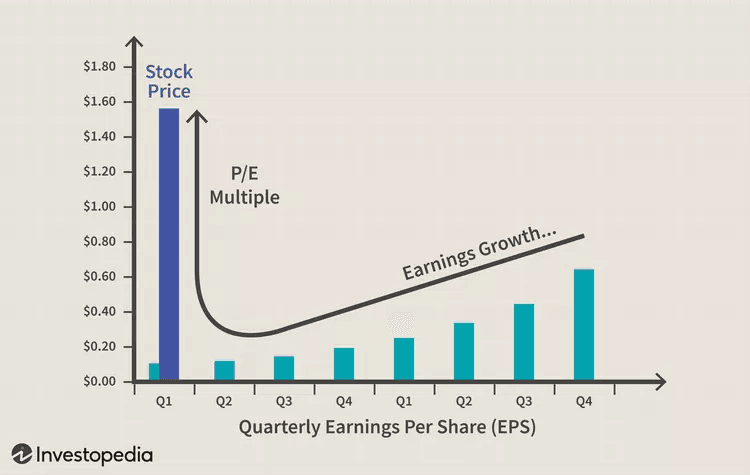
Multiple Compression: The Silent Killer of Alpha
A common pushback from advisors is: "But earnings are still growing!" The quantitative reality is that Multiple Compression can easily outpace Earnings Growth. If a company grows earnings at 10% annually, but the P/E ratio compresses from 40x to 20x over five years, the investor faces a negative total return despite the business "performing" well.
The Full-Cycle Filter identifies these "valuation peaks" by comparing current multiples to historical norms across an entire business cycle, not just the recent bull run. By defining the exit based on these mathematical thresholds, you aren't "guessing" the top; you are systematically reallocating capital to assets with a higher probability of meeting your hurdle rate.
For a professional audience, Section 3 is where the rubber meets the road. It addresses "Career Risk"—the very real danger of being right on the math but "wrong" on the timing. In the world of institutional advising, being early is often indistinguishable from being wrong.
Managing the "Time Lag" and Client Expectations
The most significant hurdle in valuation-based selling is the convergence gap. As the data indicates, fundamental valuations have a negligible correlation with stock prices over a 12-to-24-month horizon. For a portfolio manager, this creates a period of "performance pain" where a sold position continues to climb, fueled by momentum or macro tailwinds. Managing this period requires a shift from prediction to probabilistic risk management.
The Correlation Convergence
The "Full-Cycle" approach relies on the mathematical reality that stock prices eventually tether to earnings.
However, the lead-lag relationship is non-linear.
The 2-Year Noise: Over short periods, sentiment and liquidity drive the multiple. Selling a high-quality name at 30x earnings only to see it go to 45x is not a failure of the model, but a manifestation of market duration.
The 10-Year Gravity: By year seven, the "gravity" of the starting earnings yield becomes the dominant driver of CAGR. The objective is to ensure the client’s capital is positioned where the probability of outperformance is highest over the full cycle, not the next four quarters.
Reframing "Sell" as Risk Mitigation, Not Market Timing
Professional advisors must pivot the conversation with clients from "I think the price will drop tomorrow" to "The current price has decoupled from the earnings algorithm."
The Asymmetric Risk Profile: An overvalued quality stock possesses a "compressed spring" of downside risk. While it may stay expensive for years, any earnings miss or macro shift triggers a violent re-rating. Selling is an act of removing "uncompensated risk" from the portfolio.
Opportunity Cost vs. Realized Loss: Explain that underperforming the benchmark while holding a "safe" name is a quiet destroyer of long-term wealth. If the equal-weighted index returns +97% and your high-quality "staple" returns +60%, the "safety" of that name costs the client 37% in absolute terminal value.
Communication Strategies for the "Intermediate Underperformance"
How do you retain client trust when the "Sell" rating hasn't "worked" yet?
The Benchmark Pivot: Compare the holding’s total return to the $RSP$ rather than its own historical price. Visualizing the relative decay helps clients see that while the stock is "up," it is actually "losing" against the broader market.
The "Yield-on-Cost" Fallacy: Educate clients that "holding for the long term" is only a virtue if the underlying earnings yield justifies the capital allocation.
The Full-Cycle Mandate: Set the expectation at the outset that valuation calls are 5-to-10-year maneuvers. By the time the valuation matures, the wisdom of the exit becomes self-evident in the alpha generated.
In a high-interest-rate environment, the cost of waiting for a bubble to burst is higher than it was in the zero interest rate era. The "Time Lag" is no longer subsidized by zero-percent cash; the hurdle rate has returned, making disciplined exits more critical than ever.
Automating the Full-Cycle Discipline
Identifying a "Good Business, Bad Investment" is only half the battle. For the professional advisor, the true challenge lies in execution. The psychological friction of exiting a high-quality name—and the manual overhead of monitoring multiple contraction across a diversified portfolio—often leads to "analysis paralysis" while alpha evaporates.
This is where Surmount Wealth transforms your research into a systematic advantage.
Our platform allows you to bridge the gap between valuation theory and portfolio reality through automated trade strategies. Whether you want to implement the "Full-Cycle Analysis" we’ve discussed today or deploy your own proprietary fundamental filters, Surmount gives you the tools to automate the entire lifecycle of a trade.
Why Top-Tier Advisors Use Surmount:
Automate Any Thesis: Don't just write about valuation gaps—code them. Build custom logic that triggers entries and exits based on earnings yields, historical growth rates, or macro-regime shifts.
Eliminate Emotional Drag: Set your parameters for "overvalued" quality stocks and let the system handle the divestment. Remove the career risk of "holding too long" by sticking to a mathematically driven exit strategy.
Custom or Prebuilt Solutions: Choose from our library of sophisticated, institutional-grade strategies or build a bespoke automated workflow tailored to your firm’s unique investment philosophy.
Full-Cycle Monitoring: Our engine tracks the 5-to-10-year fundamental correlations for you, ensuring your portfolio remains aligned with long-term valuation gravity without requiring constant manual re-balancing.
Stop Tracking Underperformance. Start Automating Alpha.
The market doesn't wait for you to find the time to click "Sell." If you believe that valuation is the ultimate arbiter of long-term returns, it’s time to institutionalize that belief.
[Book a Demo with Surmount Wealth Today]
See how our automated strategies can turn your high-conviction valuation thesis into a precise, hands-off engine for outperformance. Schedule your walkthrough now and see the future of systematic wealth management.
Related


Get Started
Experience the full power of our SaaS platform with a risk-free trial. Join countless businesses who have already transformed their operations. No credit card required.

FAQs
How can this impact my business?
How long does an this take to implement?
Will we need to make changes in our teams?

Still have a question?
Get in touch with our team.

