
Blog

Earnings Quality Analysis: Why Consensus Beats Can Mislead
Earnings season is one of the most data-rich periods in the investment calendar. Yet for all the commentary it generates, the headline EPS beat remains one of the most overused and analytically shallow signals in professional investing.
A company reports, the number clears consensus by a few cents, the financial media declares a win, and the stock sometimes sells off anyway. For portfolio managers who have watched this dynamic play out across multiple cycles, the frustration is familiar. The problem is not the data — it is the framework being applied to it.
Earnings quality analysis exists precisely to cut through that noise.
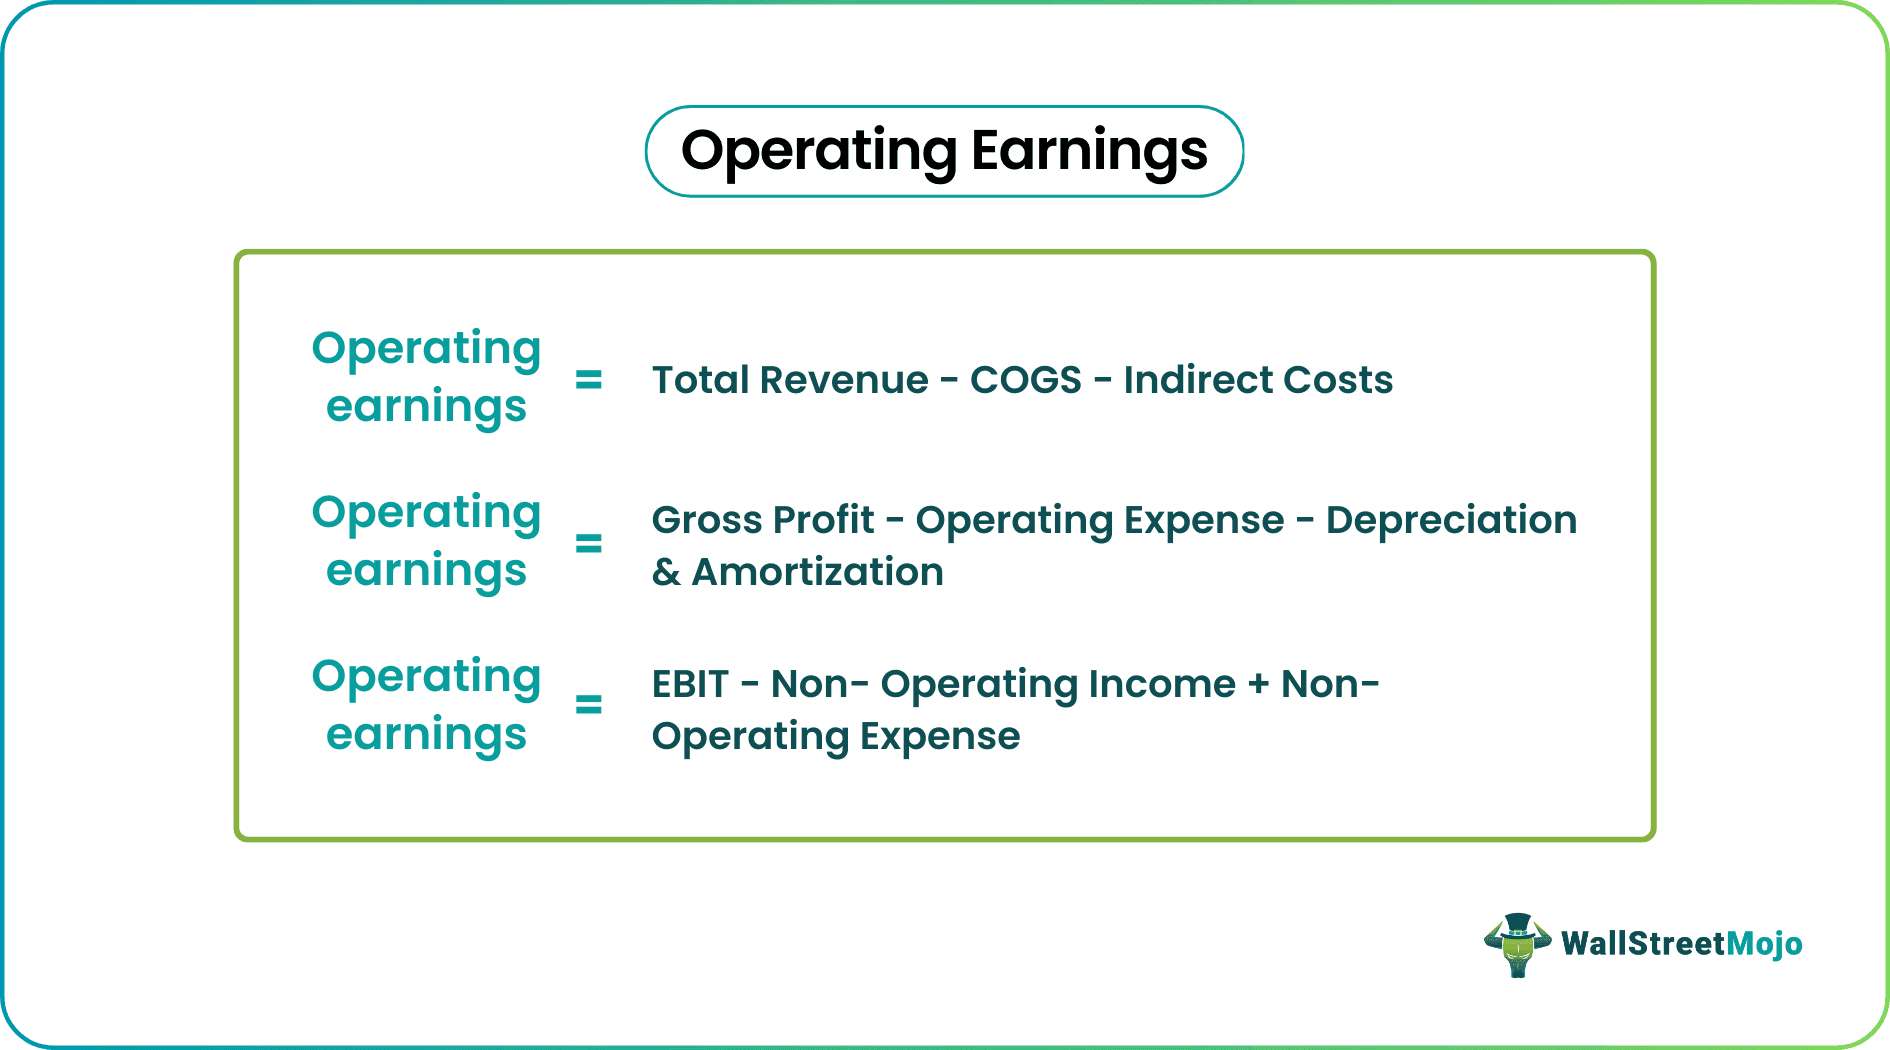
How Reported EPS Distorts Operating Earnings
Reported EPS is a GAAP figure, and GAAP accounting is built for legal and regulatory compliance, not investment analysis. It captures everything – restructuring charges, litigation settlements, asset sale gains, and investment portfolio liquidations — regardless of whether those items reflect the ongoing earnings power of the business.
Non-GAAP earnings, by contrast, attempt to strip those items out. Neither figure is inherently correct. The analytical discipline lies in understanding exactly what has been included, excluded, and why. Accepting either number at face value without interrogating the income statement is not sound analysis.
How One-Time Gains Inflate Reported EPS
Below-the-line items are where reported EPS most frequently diverges from operating reality. A large capital gain from the sale of an investment position, for example, can add several dollars to reported EPS in a single quarter while contributing nothing to the recurring earnings power of the business.
When a mega-cap constituent generates this kind of gain, the distortion does not stay contained to that single stock — it flows through to index-level S&P 500 reported EPS, inflating the aggregate number and flattering the apparent earnings growth rate for the entire benchmark. Analysts who track only the top-line beat miss this entirely.
Adjusted vs Reported EPS
Experienced sell-side analysts adjust for these distortions, and their behavior is worth watching. When a significant one-time gain inflates a current quarter's reported EPS, the rigorous analyst will revise down the comparable quarter in the following year to reflect the absence of that gain. This forward estimate revision is the signal that something non-recurring has been correctly identified and removed from the ongoing earnings model. If you are not watching forward estimate revisions alongside current quarter results, you are reading only half the story.
A Framework for Earnings Normalization
The starting point for any earnings quality analysis is the income statement itself, read line by line.
Non-recurring items tend to cluster in predictable places: gains or losses on investment sales, impairment charges, restructuring costs, and litigation-related items.
The critical discipline is asking, for each item: will this appear again next quarter, next year, and the year after? If the honest answer is no, it does not belong in your normalized earnings figure. This sounds straightforward, but it requires going beyond the press release to the actual filing — a step a surprising number of institutional analysts skip during the high volume of earnings season.
How to Normalize Forward Earnings Estimates Across an EPS Revision Cycle
Once non-recurring items are identified and stripped, the next step is rebuilding a clean forward earnings estimate. This means adjusting not just the current quarter but the full forward four-quarter estimate stack, since one-time items in the current period create artificial comparisons in future periods. Tracking the revision cycle — how sell-side consensus estimates move in the weeks following a report — tells you whether the broader analyst community has caught up to the normalization. A sharp downward revision to a future quarter's expected EPS growth rate, shortly after a current-quarter beat, is frequently the market's way of acknowledging that a one-time item inflated the reported number.
Operating Leverage and Earnings Visibility — The Signals Worth Trusting
After normalization, the metrics worth focusing on are those that speak to the structural earnings trajectory of the business: revenue growth on a same-basis comparison, operating income margin direction, and the conversion of operating income to free cash flow. Operating leverage — the rate at which incremental revenue flows through to operating income — is one of the most durable indicators of earnings quality available to the analyst. A business expanding operating margins on organic revenue growth is demonstrating something real. A business beating EPS on a below-the-line investment gain is demonstrating accounting, not business momentum.
What Earnings Quality Analysis Means for Portfolio Management Decisions
The market is generally better at earnings quality analysis than the financial media gives it credit for. When a stock sells off on a reported beat, the most common explanation is not irrational behavior — it is that institutional participants have read the income statement, identified the non-recurring component, and repriced the stock on normalized earnings. The post-earnings price action is often the market publishing its own quality-adjusted verdict. For portfolio managers, this is worth treating as information rather than noise.
Index-Level Earnings Distortion
The distortion problem scales. When multiple large-cap index constituents record significant non-recurring gains in the same quarter, the S&P 500's reported EPS growth rate can materially overstate the index's true operating earnings momentum. This creates a false read on the health of the earnings cycle that can influence asset allocation decisions if taken at face value. Benchmark-level earnings analysis demands the same line-item discipline as single-stock analysis — arguably more, given how few practitioners apply it at that level.
Remember, on paper, a company can have solid earnings, but that does not necessarily make it a good investment.
Building an Institutional Earnings Interpretation Process
The goal of earnings quality analysis is not to be contrarian for its own sake — it is to build a repeatable process that produces a more accurate picture of business earnings power than the consensus headline provides. That means reading primary source filings, not press releases. It means tracking estimate revisions, not just estimate levels. And it means distinguishing between a business that is compounding its earnings power and one that is simply reporting a number that cleared a bar.
Across multiple market cycles, that distinction is where durable investment edge is built and sustained.
Put Your Earnings Quality Thesis on Autopilot
Reading the income statement correctly is only half the battle. The other half is acting on it — consistently, systematically, and without the emotional friction that earnings season inevitably introduces. That is exactly where Surmount Wealth comes in.
Surmount Wealth's automated trade strategy platform lets portfolio managers and investment advisors translate any investment thesis — however nuanced — into a rules-based, automated strategy that executes with precision. Whether you are working from a prebuilt strategy or building something entirely bespoke, Surmount removes the gap between analytical insight and portfolio action.
What Would an Earnings Quality Strategy Actually Look Like?
To make this concrete, consider a hypothetical strategy built around the dynamics discussed in this post — call it the Earnings Quality Filter.
This is a hypothetical example for illustrative purposes only. It does not represent an existing Surmount Wealth strategy, and nothing here constitutes investment advice or a recommendation.
The hypothetical rules might look something like this:
Entry signal: A large-cap holding reports a headline EPS beat, but the forward four-quarter estimate for the comparable period is simultaneously revised downward by sell-side consensus, flagging a likely non-recurring item inflating the current quarter result. The strategy fades the initial post-earnings pop, initiating or adding to a short-duration underweight position.
Exit signal: When normalized operating earnings estimates stabilize or begin revising upward, confirming that recurring earnings momentum has reasserted itself — the underweight is closed and a long position is initiated.
Risk overlay: Position sizing is capped as a percentage of portfolio exposure, with a hard stop tied to a predefined move in the broader index to manage systematic risk during earnings season volatility.
This kind of structured, rules-based approach removes the judgment call in the moment — the exact moment when cognitive load is highest and discipline is most likely to slip. The thesis is baked in. The strategy executes it.
Prebuilt or Fully Custom — Built Around Your Process
If you already have a thesis as developed as the one above, Surmount's custom strategy builder gives you the tools to encode it precisely. If you are looking for a starting point, Surmount's library of prebuilt strategies covers a wide range of market dynamics and can be deployed immediately or modified to fit your existing framework.
Either way, the platform is built for professionals who think rigorously about markets and want their execution infrastructure to reflect that rigor.
Takeaway
If this post resonated with how you think about earnings, there is a good chance Surmount Wealth was built for how you manage money. See the platform in action, ask the hard questions, and find out how close you are to having your best analytical work running automatically in client portfolios.
Your edge is in the analysis. Let Surmount handle the execution.
Related


Get Started
Experience the full power of our SaaS platform with a risk-free trial. Join countless businesses who have already transformed their operations. No credit card required.

FAQs
How can this impact my business?
How long does an this take to implement?
Will we need to make changes in our teams?

Still have a question?
Get in touch with our team.

