Harmonic Mean P/E: How Index Providers Measure Valuation

Harmonic Mean P/E: How Index Providers Measure Valuation
Take a two-holding portfolio split evenly between a stock at 10x earnings and a stock at 100x earnings. Most spreadsheets return a blended multiple of 55x, implying extreme valuation.
That number is wrong, a reminder that single-figure shortcuts like the PEG ratio can mislead. The actual multiple on the earnings this portfolio owns is closer to 18x. The gap is a basic averaging error that major index and fund-data providers avoid.
This guide explains the harmonic mean P/E method they use, why it matters for advisors who monitor portfolio-level valuation, and how to handle the edge cases that break simpler models.
What Is the Harmonic Mean P/E?
The harmonic mean P/E is a portfolio-level multiple calculated by averaging each holding's earnings-to-price ratio (E/P), weighted by position size, and then taking the reciprocal. The formula is:
Portfolio P/E = 1 / Σ (wᵢ / P/Eᵢ)
Where wᵢ is each holding's portfolio weight. Because it works with earnings rather than price in the numerator, it reflects how much profit each dollar of capital actually controls.
Why the Weighted Average P/E Overstates Valuation

A simple weighted average P/E multiplies each holding's multiple by its weight and adds the results. The problem is that P/E places price in the numerator. A high-multiple position contributes very little earnings but a very large ratio, so it pulls the arithmetic result far above economic reality.
A Worked Portfolio P/E Ratio Example
Using the same $1,000 portfolio described above:
Holding A: $500 at 10x earnings controls $50 of annual earnings.
Holding B: $500 at 100x earnings controls $5 of annual earnings.
Arithmetic method: (0.5 × 10) + (0.5 × 100) = 55x.
Harmonic method: 1 / (0.5/10 + 0.5/100) = 1 / 0.055 = 18.2x.
Cross-check: $1,000 of capital ÷ $55 of combined earnings = 18.2x.
The arithmetic figure is roughly three times the true portfolio P/E ratio. The harmonic result matches the cross-check because both measure total price paid relative to total earnings owned.
How Index Providers Calculate the Index P/E Ratio
Major providers do not use simple arithmetic averages.
MSCI's Aggregate Market-Cap Approach
MSCI's Fundamental Data Methodology calculates index-level valuation ratios by summing the market capitalization of constituents and dividing by their summed trailing 12-month earnings. Securities without an available trailing figure are excluded from that ratio.
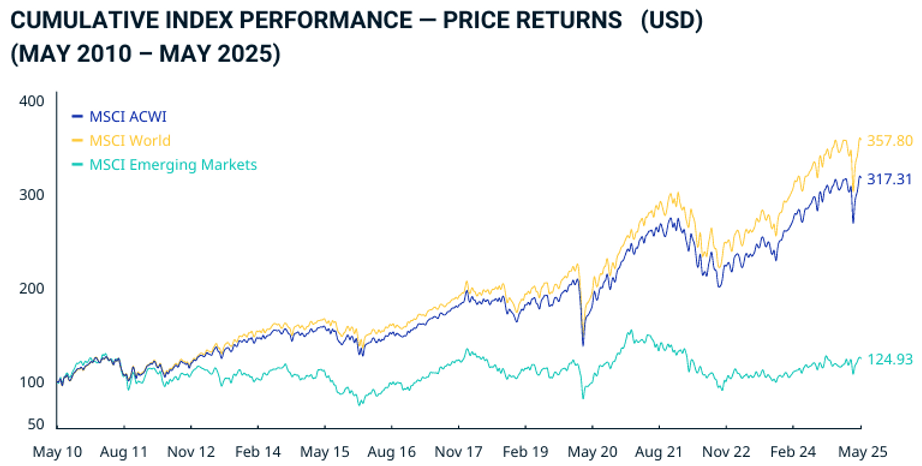
This aggregate method produces the same result as a capitalization-weighted harmonic calculation, which is why index weighting shapes every published figure. In practice, the published index P/E ratio already reflects this logic, as do longer-horizon measures like the CAPE ratio.
Morningstar's Fund P/E Ratio Method
Morningstar's glossary describes its fund P/E ratio as an asset-weighted average of the earnings yields of a fund's holdings, followed by the reciprocal. Morningstar moved to a harmonic weighted average in November 2005, noting the change keeps outliers from skewing results.
If an internal spreadsheet uses arithmetic weighting, its output will not reconcile with the provider data clients and investment committees often see.
Using Earnings Yield to Calculate It in Four Steps
Working in earnings yield terms is the cleanest way to build this into a model:
Convert each holding's P/E to E/P (for example, 20x becomes 5%).
Multiply each E/P by the holding's portfolio weight.
Sum the weighted values to get the portfolio's blended E/P.
Take the reciprocal of that sum to return to a P/E multiple.
A zero-earnings holding simply contributes 0% to the sum, rather than producing an undefined ratio.
Handling Negative Earnings P/E in Aggregate Valuation
Loss-making holdings are where most portfolio models break. A negative earnings P/E has no meaningful interpretation on its own, and neither provider methodology cited above sets out a specific rule for it. Practitioners generally choose between two approaches.
The Exclusion Method with Coverage Disclosure
This method calculates the multiple only across profitable holdings and reports what share of the portfolio is covered, for example "18.5x across 90% of portfolio weight."
Strength: small loss-making positions do not distort the figure for the rest of the book.
Limitation: the reported multiple ignores the drag from unprofitable holdings, so coverage must always be disclosed alongside it.
The Aggregate Dollar Method
This method sums the dollar earnings attributable to each position, losses included, and divides total portfolio value by the net figure.
Strength: it reflects the true net earnings the portfolio controls.
Limitation: if losses approach or exceed profits, the result becomes extremely high or undefined.
Neither method is universally correct for aggregate valuation. What matters is choosing one deliberately and applying it the same way every period.
Building a Consistent Valuation Methodology
A portfolio-level multiple is only useful if it is comparable across time and client accounts. A documented valuation methodology should specify:
Earnings basis: trailing 12-month or forward estimates, the data source for each, and earnings quality.
Weighting rule: harmonic weighting by market value, applied consistently.
Edge-case policy: how zero and negative earners are treated, with coverage disclosed.
Refresh cadence: how often prices, weights and earnings are updated.
Sector caveats: where P/E is a weak measure, such as for lenders and other financials, a supplementary metric may be more informative.
Aggregate multiples complement, rather than replace, company-level analysis such as a well-built DCF model. Applied consistently, the harmonic mean P/E acts as a high-level check on whether a portfolio's valuation profile has drifted from its mandate.
Conclusion
The harmonic mean P/E is not an academic refinement. It is the method that keeps a portfolio-level multiple anchored to the earnings a portfolio actually owns, and it reflects how major providers such as MSCI and Morningstar construct their published figures. Advisors who align their internal models with that logic, and who set clear rules for loss-making holdings, gain a valuation measure that reconciles with external data, holds up to scrutiny and can feed rules-based review processes.
Turn Your Valuation Rules into Automated Workflows with Surmount Wealth
Getting the math right once is easy. Applying it consistently across every account, every rebalance and every reporting cycle is where spreadsheets fall short. Surmount Wealth lets advisors and portfolio managers turn rules-based theses, including the valuation discipline in this article, into automated strategies that run on top of existing brokerage accounts.
A hypothetical illustration: the "Valuation Guardrail" strategy
This is a hypothetical concept for illustration only. It is not a live strategy, has no performance history, and is not a recommendation.
Monitor: recalculates each portfolio's harmonic mean P/E on a set schedule using a consistent earnings basis.
Disclose: reports coverage alongside the multiple whenever loss-making holdings are excluded.
Flag: alerts the advisor when the aggregate multiple moves beyond a user-defined band relative to a chosen benchmark.
Review: routes flagged accounts into a rebalancing review rather than trading automatically, keeping the advisor in control.
Assumptions and limitations: thresholds, benchmarks and earnings data sources are user-defined. Results would depend on data quality and the rules selected. Hypothetical concepts have inherent limitations and do not reflect actual trading.
Why advisors explore Surmount Wealth:
No asset transfers: connects to existing brokerage accounts.
No coding required: build from prebuilt strategy libraries or define custom rules.
Test before automating: evaluate rules against historical data before switching them on.
Consistency at scale: apply the same methodology across every client account.
Advisor oversight: you set the rules and approve the workflow.
See how your valuation rules could run automatically. Book a demo today.
This content is for educational purposes only and should not be taken as investment advice. Surmount Wealth does not guarantee any outcome.
FAQ: Harmonic Mean P/E
What is the harmonic mean P/E?
It's a portfolio-level multiple found by averaging each holding's weighted earnings yield and taking the reciprocal. This keeps high-multiple outliers from inflating the result.
Why not use a weighted average P/E?
P/E puts price in the numerator, so a weighted average P/E over-weights high-multiple holdings. It can overstate portfolio valuation several times over.
Who uses the harmonic mean for P/E?
Major data providers do. MSCI aggregates market cap over earnings, and Morningstar has used harmonic weighting since 2005.
How are negative earnings handled?
Practitioners either exclude loss-making holdings and disclose coverage, or net all dollar earnings together. Whichever rule is chosen, applying it consistently matters most.
When should advisors track portfolio P/E ratio?
It works best as a periodic, high-level check that valuation hasn't drifted from the portfolio's mandate. It supports company-level analysis rather than replacing it.
