
Blog

Is PEG Ratio a Good Valuation Metric?
For portfolio managers building systematic screens, the price/earnings-to-growth ratio remains one of the most widely used shorthand valuation tools. But is PEG ratio a good valuation metric on its own, or does it require guardrails to avoid rejecting genuinely strong holdings? The honest answer is: it depends on how it's applied.
What Is a Good PEG Ratio?
As a general heuristic, a PEG ratio below 1.0 is often considered attractively valued relative to projected growth, while a ratio above 2.0 suggests a stock may be priced for more growth than it's likely to deliver. Many practitioners use a "forgiving" threshold — somewhere between 1.0 and 1.5 — to leave room for high-quality names that trade at a premium multiple but still justify it through durable growth.
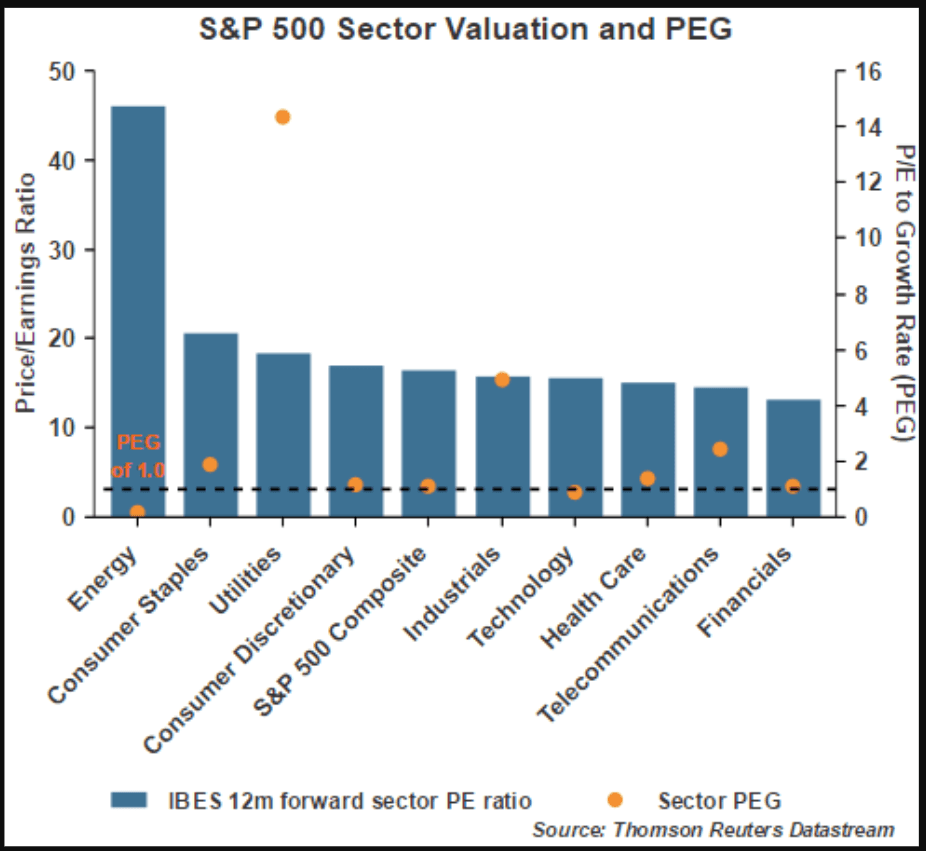
The challenge is that "good" is context-dependent. A PEG ratio that looks reasonable for a cyclical industrial name may be entirely inappropriate for a software company with recurring revenue and structurally higher margins. Treating PEG as a universal cutoff, rather than a sector-relative signal, is where many screening frameworks run into trouble — a challenge shared by other single-metric valuation shortcuts advisors rely on.
PEG Ratio vs. P/E Ratio: What's the Difference?
The price-to-earnings ratio tells you what the market is paying for a dollar of current earnings. PEG ratio vs P/E ratio comes down to one added dimension: growth. By dividing the P/E ratio by the expected earnings growth rate, PEG attempts to answer a more useful question — is this valuation justified by how fast the company is expected to grow?
In theory, this makes PEG a more complete tool than P/E alone. A stock with a high P/E but even higher growth expectations may actually be cheaper, on a growth-adjusted basis, than a low-P/E stock with stagnant earnings. In practice, however, PEG inherits every weakness of the growth estimate it's built on — and as we've explored in analyzing why consensus beats can mislead, forward growth projections are frequently wrong, revised, or inconsistent across data providers.
Where PEG Ratio Falls Short: Key PEG Ratio Limitations
PEG Ratio as a Growth-Adjusted Valuation Metric
Used correctly, PEG ratio as a growth-adjusted valuation metric can help filter out stocks that are expensive without the growth to support it. But the calculation is only as reliable as its inputs. A one-year forward growth estimate can be skewed by a single easy comparison period, a one-time revenue event, or analyst optimism that doesn't hold up. Applying a strict PEG limitations lens matters here: the ratio can flag a temporarily inflated growth rate as "cheap" and a temporarily depressed one as "expensive," even when neither reflects the company's underlying trajectory.
Why Rigid PEG Cutoffs Reject Quality Compounders
The bigger structural issue shows up when PEG is used as a hard pass/fail gate rather than one input among several. High-quality, durable businesses with strong competitive moats often trade at premium multiples precisely because the market has justified confidence in their earnings power — and a strict PEG ceiling can screen these names out entirely, simply because their growth rate doesn't numerically outpace their multiple. This is one of the more common PEG ratio limitations advisors encounter: the metric can systematically reject exactly the kind of resilient, high-conviction holdings a portfolio might benefit from, while passing more volatile, less durable names that happen to clear the math.
Building Better Valuation Guardrails for Portfolios
None of this means PEG should be discarded — it means it shouldn't operate in isolation. Effective valuation guardrails for portfolios typically combine PEG with balance sheet strength, margin durability, and revenue quality, so that no single ratio can single-handedly disqualify — or approve — a position.
Multi-Factor Stock Screening as a Rules-Based Valuation Framework
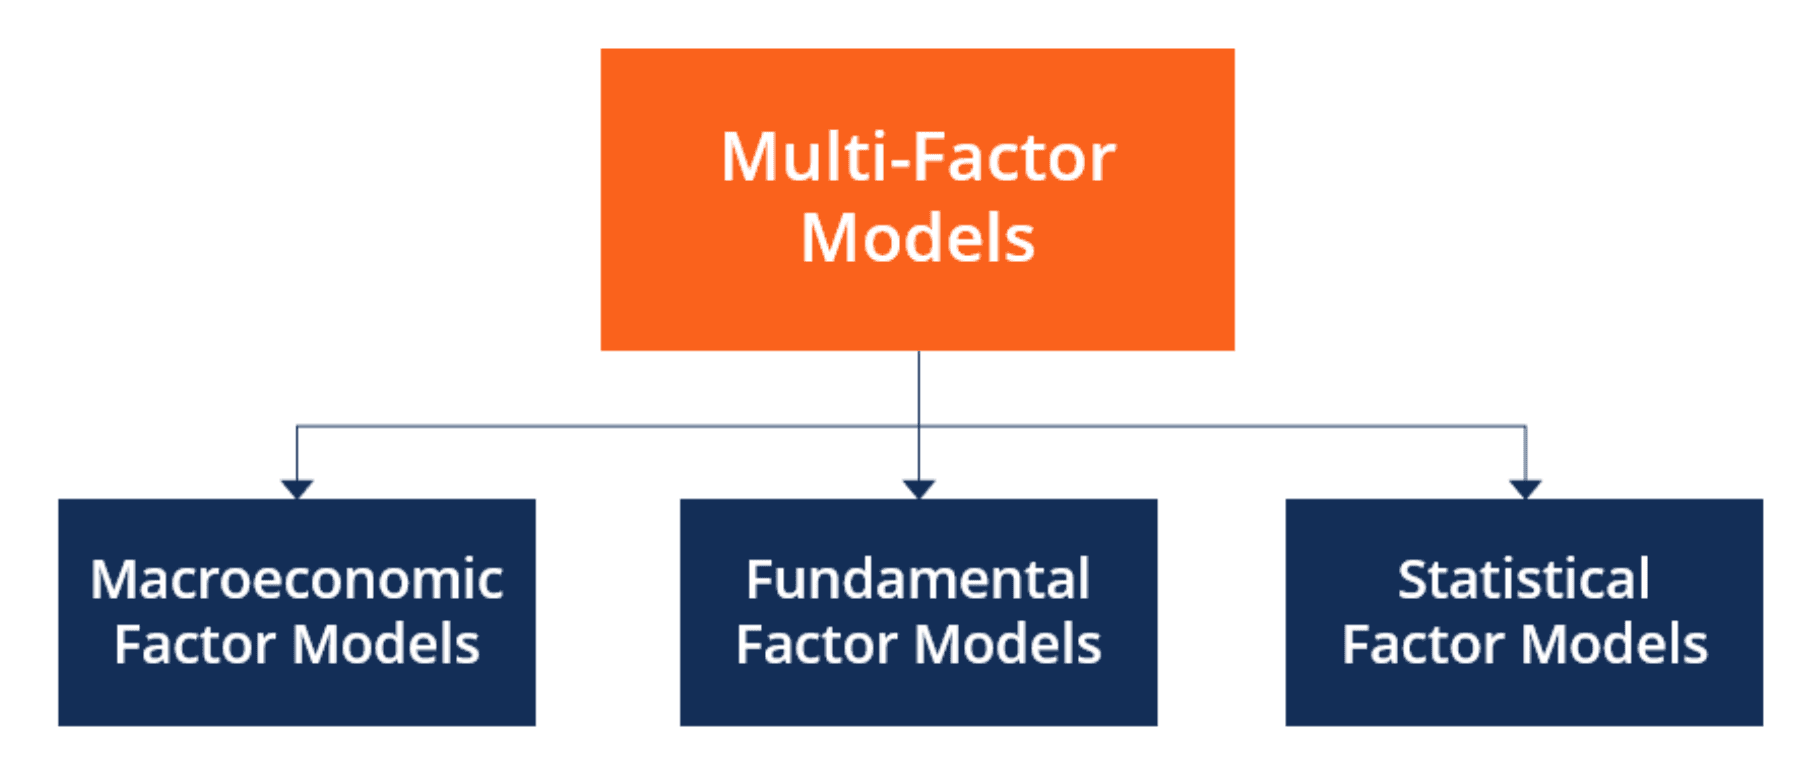
This is where multi-factor stock screening earns its place. Rather than relying on one metric with a fixed cutoff, a rules-based valuation framework can weight PEG alongside solvency, cash generation, and momentum indicators — the same logic behind systematic sell signals — applying each as a graded input rather than a binary gate. This approach preserves the discipline of systematic screening while reducing the risk of discarding sound holdings over a single, growth-estimate-dependent number. It also allows thresholds to be researched, tested, and adjusted deliberately, rather than reactively loosened every time the screen produces a result that doesn't sit right.
Conclusion: Using PEG Ratio Wisely in a Systematic Process
So, is PEG ratio a good valuation metric? Used thoughtfully — as one signal within a broader, rules-based valuation framework — it can meaningfully improve screening discipline. Used as a rigid, standalone cutoff, it risks filtering out exactly the durable, high-quality names an advisor most wants to hold. The distinction isn't whether to use PEG, but how much weight to give it, and what other signals should sit alongside it in a systematic process.
Turn Valuation Discipline Into an Automated Strategy
Reading about the limitations of a single-metric cutoff is one thing. Actually building a portfolio process that avoids them is another — and that's exactly the gap Surmount Wealth's automated trade strategy infrastructure is built to close.
Instead of manually re-running a PEG screen every quarter and second-guessing whether a name that "failed" deserves another look, Surmount lets RIAs and portfolio managers automate the entire thesis — including a multi-factor approach like the one discussed above — directly on top of an existing brokerage account. No fund transfers. No custom code. No rebuilding your logic from scratch every time your assumptions evolve.
As an illustration of what this could look like, consider a hypothetical strategy concept:
Multi-Factor Valuation Guardrail (Hypothetical / Illustrative Only)
A rules-based framework that could weight PEG ratio alongside balance sheet solvency, gross margin durability, and revenue growth consistency — rebalancing positions when a company's composite score shifts, rather than triggering a binary pass/fail on PEG alone. This is a hypothetical illustration of strategy mechanics only. It does not reflect an actual Surmount strategy, and no backtested or projected performance is implied or should be inferred. Any real strategy would need to be built, tested, and reviewed before use.
With Surmount, a framework like this — or your own — can be built, tested, and automated without writing a single line of code:
Automate multi-factor screening logic — combine valuation, quality, and growth signals into one rules-based process instead of relying on a single metric
Remove manual re-screening — let automation handle ongoing evaluation as fundamentals and estimates change
Keep your existing brokerage account — no need to transfer assets to access professional-grade strategy infrastructure
Test before you commit — validate strategy logic before deploying it live
Apply this to any thesis — valuation discipline is just one example; the same infrastructure supports virtually any systematic investment approach
Built for advisors and portfolio managers — designed for professionals managing client or personal capital at scale
If a rigid PEG cutoff has ever cost you a name you wish you'd kept — or let one through you later regretted — it may be time to see what a fully automated, multi-factor process could do for your process.
Book a demo with Surmount Wealth today →
FAQ: Is PEG Ratio a Good Valuation Metric?
What counts as a good PEG ratio?
Generally, a PEG ratio below 1.0 is considered attractively valued, though "good" depends heavily on sector and growth stability.
How is PEG ratio different from P/E?
PEG ratio vs P/E ratio comes down to growth: PEG divides P/E by expected earnings growth to show if a valuation is justified.
Why does PEG ratio reject quality stocks?
Rigid PEG cutoffs can screen out durable, high-quality compounders simply because their growth rate doesn't outpace their premium multiple.
When should PEG ratio not be used alone?
PEG relies on forward growth estimates, which are frequently revised — pairing it with other factors reduces this single-metric risk.
What is a rules-based valuation framework?
It's a systematic approach that weights PEG alongside solvency, margins, and growth quality, rather than using one metric as a binary gate.