
Blog

Rolling Correlation as a Portfolio Construction Tool
Rolling correlation portfolio construction treats diversification as a live measurement rather than a fixed assumption. The tool is analytical rather than software: a correlation coefficient recalculated across a sliding window, so advisors watch relationships between holdings move in close to real time. Most client books receive a formal review each quarter. Correlation does not observe that calendar. The gap between those cadences is where diversification quietly stops working, and where a balanced-looking book behaves like one concentrated position.
What Rolling Correlation Portfolio Construction Measures
A rolling calculation answers a narrower question than a standard correlation figure. Rather than asking how two holdings moved across an entire sample period, it asks how they are moving now, using only the most recent observations in the window.
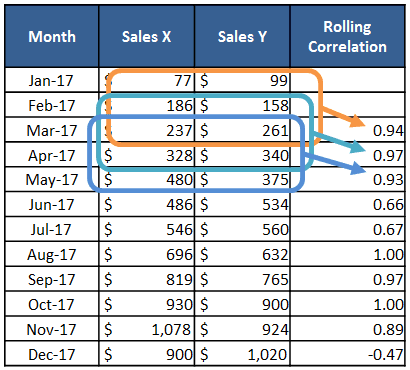
That distinction changes what the number is good for:
It exposes trend rather than level, and a pair drifting from 0.2 to 0.7 says more than either reading alone
It surfaces regime changes early, while position sizes are still adjustable
Beyond the Static Correlation Matrix
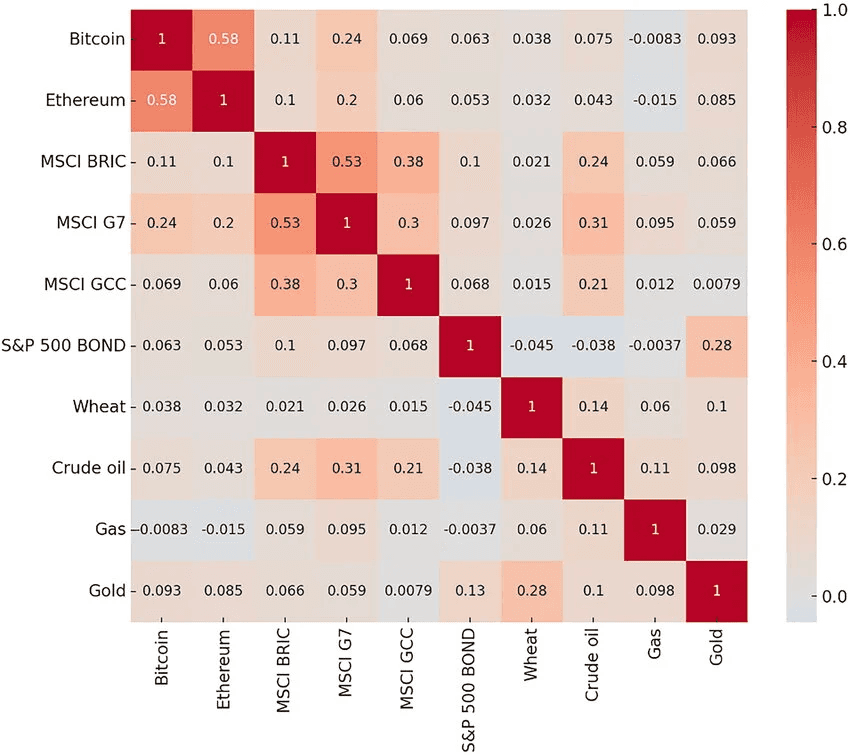
A static correlation matrix reports one coefficient per pair across a fixed historical period. It is a single photograph of a relationship that has been moving the entire time it was measured.
What that photograph conceals:
Averaging effect: a pair that ran strongly negative early and strongly positive later can average out to roughly zero
Regime blending: calm and stressed periods fold into one undifferentiated figure
False comfort: a low average correlation reads as diversification when it may be an artifact
A core-satellite allocation, for instance, assumes a stable core-to-satellite relationship that a static matrix cannot verify.
Choosing a Rolling Correlation Window
The rolling correlation window is the number of trailing observations included in each calculation, and it is the most consequential parameter in rolling correlation portfolio construction. There is no universally correct setting, only a trade-off chosen deliberately or inherited by default.
Two failure modes sit at either end:
Too short, and the series becomes noise, where every minor move reads as a regime change and triggers fire constantly
Too long, and the series flattens into a slow-moving average that misses the shift you were trying to catch
Short Lookbacks, Long Lookbacks, and Data Frequency
Three decisions sit inside that choice:
Length: short windows respond faster and produce more false signals, while long windows stay stable but lag turning points. Running two lengths in parallel and treating divergence as the signal is one common workaround.
Return frequency: daily returns give more observations per window but carry more microstructure noise, and weekly returns smooth that at the cost of responsiveness.
Re-estimation cadence: recalculating daily on overlapping windows produces serially correlated readings, so thresholds set against that series need to account for the smoothing.
These are assumptions to document, so that when a reading changes you can tell whether the portfolio moved or the parameter did.
Diagnosing Portfolio Diversification Risk
Portfolio diversification risk is rarely the absence of diversification at purchase. It is the erosion of it afterward, the dynamic that turns index-level concentration into unintended risk. Rolling correlation portfolio construction gives that erosion a visible shape, usually in one of two forms.
Correlation Clustering Across Holdings
Correlation clustering occurs when holdings selected for different reasons begin responding to the same underlying driver, whether a single narrative, a rate expectation, or a shared factor exposure. It is how a book arrives at sector overconcentration without any single decision looking wrong.
Warning signs worth monitoring:
Several unrelated pairs rising toward each other within the same window
Positions intended to offset one another trending positive together
Sector labels that no longer describe what is actually driving returns
The structural trap is a paired position described as a hedge that functions as a doubled exposure. On paper the two legs are opposites. In the rolling series, they converge.
Correlation Breakdown in Market Stress
Correlation breakdown in market stress is the better-documented failure. Diversifying relationships compress toward one precisely when that diversification is needed, as broad deleveraging overwhelms the security-specific factors that had kept holdings apart, the mechanism behind most cross-market contagion episodes.
What a rolling view adds:
It shows compression building ahead of the stress peak, not only in hindsight
It gives an evidence base for client conversations about why a diversified book still drew down
Turning Readings Into Rebalancing Triggers
A measurement becomes a process only when attached to a pre-defined rule, which is why rebalancing cadence and rebalancing conditions are two separate design decisions. Rebalancing triggers convert rolling correlation portfolio construction from analysis into governance.
A workable trigger specification states:
The pair or cluster being monitored
The window length and return frequency used
The threshold level, and how long it must persist before anything happens
The prescribed response, such as a weight cap or a review flag
Writing thresholds in advance removes discretion at the moment discretion is least reliable, the same logic that underpins systematic sell signals.
Dynamic Asset Allocation and Risk-Adjusted Portfolio Monitoring
Dynamic asset allocation describes any approach where weights respond to measured conditions rather than a fixed schedule. Correlation is one input such approaches can reference, alongside volatility and drawdown measures.
The difficulty is scale. Risk-adjusted portfolio monitoring across a client book means recalculating many pairs, across multiple windows, for every account:
A 20-holding portfolio contains 190 unique pairs
Two window lengths doubles that
Multiply by every account under management
That is arithmetic rather than insight. It is work that makes discretionary processes hard to scale, and that suits a rules-based system rather than a spreadsheet opened once a quarter.
Conclusion
Rolling correlation portfolio construction predicts nothing. It makes a moving relationship visible while there is still time to respond:
Static matrices average away the behavior that matters most
Window length is an assumption to document, not a default to inherit
Thresholds set in advance outperform judgment applied under pressure
Diversification is not a property a portfolio has. It is a condition that has to be measured.
Automate the Monitoring, Not the Judgment
Correlation drift is a measurement problem before it is a portfolio problem. The math is not difficult. It is just relentless, and it does not fit into a quarterly review cycle.
Surmount Wealth lets advisors turn a framework like the one above into a rules-based strategy that runs continuously on existing brokerage accounts. No asset transfers. No custodian change. No code.
A hypothetical illustration. Consider a Correlation Drift Monitor, an entirely fictional, illustrative concept created to show how a thesis becomes a rule. It is not a strategy currently offered, tested, or available:
Tracks pairwise correlation across a defined holding set on two rolling windows at once
Flags any pair whose short-window reading crosses a set threshold and stays there for a defined number of sessions
Applies a pre-set weight cap to the flagged cluster until the reading normalizes
Logs every calculation, trigger, and adjustment for review and client reporting
This example is hypothetical and for illustration only. It does not reflect any actual strategy, account, or result. It assumes clean data, stable parameters, and continuous market access, assumptions that do not always hold. No outcome is implied or projected.
Why advisors explore Surmount Wealth:
Prebuilt strategy library, plus fully custom rules built around your own framework
Backtesting environment to examine how a rule set would have behaved historically
Automated execution on accounts you already hold
Full audit trail supporting documentation and compliance review
Built for RIAs and portfolio managers, not retail workflows
Every framework you have written down is a rule waiting to be systematized. See what yours looks like running.
This content is for informational and educational purposes only and should not be taken as investment advice or a recommendation of any security, strategy, or service. Hypothetical examples are illustrative and do not represent actual or expected results.
FAQ: Rolling Correlation Portfolio Construction
What is rolling correlation portfolio construction?
It is a method of measuring correlation across a moving window, so advisors can track how relationships between holdings shift rather than assuming they hold steady.
How long should a rolling correlation window be?
There is no correct length. Short windows respond faster but generate noise, while longer windows stay stable and lag turning points.
Why does a static correlation matrix fall short?
A static correlation matrix averages calm and stressed periods into one figure, hiding the regime changes that create portfolio diversification risk.
When does correlation breakdown in market stress occur?
It occurs when broad deleveraging overwhelms security-specific factors, compressing diversifying relationships toward one exactly when diversification is needed most.
How do advisors set rebalancing triggers?
They define the pair, window, threshold, and persistence period in advance, then attach a prescribed response such as a weight cap or review flag.