
Blog

Modeling Moat Erosion: A Framework for Portfolio Managers
Every discounted cash flow model makes a claim about moat erosion, whether or not the analyst intends it. The moment you select a perpetual growth rate, you have asserted something specific about how long a company's advantage survives, usually that it survives forever. That assumption rarely appears in the memo, gets no stress test, and often carries more of the valuation than the explicit forecast years do, which is one reason even excellent businesses can disappoint as investments. This framework treats advantage duration as a variable to be estimated and defended rather than inherited from a template. The goal is not precision, but making an implicit judgment explicit enough that a committee can argue with it.
Why Terminal Value Assumptions Quietly Assume Immortality
In most models, the majority of present value sits beyond the explicit forecast window. Terminal value assumptions therefore do the heaviest lifting in the entire exercise, and like other common flaws in discounted cash flow models, they are typically set by convention: long-run GDP growth, a peer multiple, or a number carried over from the last model.
Each of those conventions embeds the same hidden claim, that the business earns returns above its cost of capital indefinitely. Economically, that cannot hold: capital chases high returns, competitors enter, and pricing normalizes. A model that never fades returns asserts the opposite.
The fix is not a better multiple. It is separating two questions the terminal value collapses into one: how large are the returns, and how long do they last? Modeled explicitly, moat erosion becomes visible instead of assumed away.
Putting a Clock on the Competitive Advantage Period
The competitive advantage period is the interval over which a company generates returns above its cost of capital. Naming it forces a number onto a judgment most analysts leave qualitative. A ten-year advantage period and a thirty-year one produce very different valuations from identical forecasts, which is why the input deserves scrutiny.
Estimating a Credible ROIC Fade Rate
Rather than switching advantage off at a fixed date, most practitioners apply a ROIC fade rate: incremental returns decline toward the cost of capital across a defined horizon. Three decisions define the curve:
Starting spread: current return on invested capital less cost of capital, normalized for cycle position. The fade curve is only as reliable as how the cost of capital itself is estimated.
Fade horizon: the number of years until that spread reaches zero.
Fade shape: linear, or front-loaded where competitive response arrives quickly.
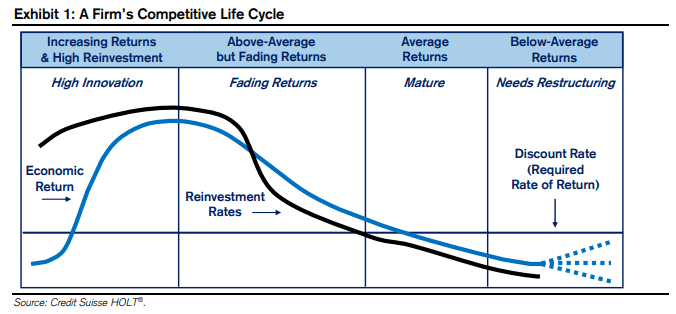
Empirical work on return persistence indicates that most companies converge toward industry averages within roughly a decade, while a small minority sustain spreads considerably longer. That distribution is the useful part: a long horizon is defensible, but an exception requiring evidence, not a default.
What Actually Sustains Excess Returns
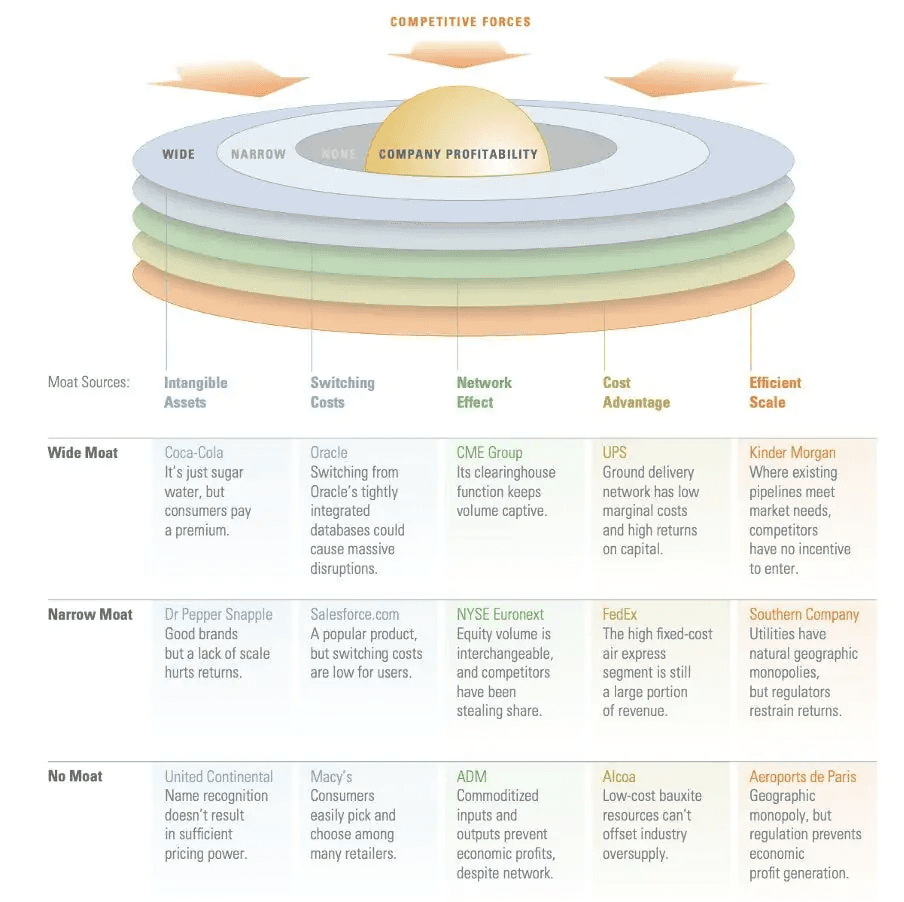
Not all advantages decay at the same rate. Excess returns backed by switching costs, regulatory position, or network effects have proven more durable than those resting on product performance or cost leadership, because the latter can be competed away by a single better release.
A practical test: ask what would have to happen for the advantage to disappear, and how many parties could make it happen. Fragmented industries illustrate this well, as how moat durability varies within a single sector makes clear. An advantage depending on one counterparty's inertia deserves a shorter clock than one embedded in thousands of customer workflows.
A Practical Approach to Economic Moat Analysis
Rigorous economic moat analysis is less about classification than monitoring. The question is not which category a moat belongs to, but whether the evidence supporting its duration still holds this quarter.
Moat Decay Indicators to Monitor
Financial statements confirm moat erosion late. These moat decay indicators typically move first:
Pricing concessions: discounting, longer payment terms, or bundling that masks unit price declines.
Rising customer acquisition cost relative to customer lifetime value.
Customer insourcing: large buyers building internal substitutes for a purchased product.
Compressing gross margin while revenue still grows, signalling volume bought with price.
Rising maintenance capex share, meaning more spending simply to hold position.
Talent outflow to direct competitors or well-funded entrants.
Narrowing technology lead, measured in release cycles rather than years.
None is conclusive alone, and reported results can obscure deteriorating fundamentals. Two or more together is grounds for shortening the advantage period in the model.
Stress-Testing Barriers to Entry
Stated barriers to entry are often circumstantial rather than structural. A three-question test:
Does the barrier survive a well-capitalized entrant willing to absorb losses for years?
Does it survive a technology shift that resets the relevant cost curve?
Does it survive the largest customer choosing to build rather than buy?
A barrier that fails any of the three is real but time-limited, and the model should say so.
Assessing the Reinvestment Runway
Duration without capacity to redeploy capital is worth less than it appears. The reinvestment runway, how much capital the business can put to work at high incremental returns, determines whether a long advantage period compounds or merely preserves. A shorter period paired with wide reinvestment capacity can be worth more than a long one on a saturated base. Modeling both avoids mistaking durability for growth.
Building Moat Erosion Reviews Into a Repeatable Process
Moat erosion is gradual, which is why it escapes quarterly review cycles, and why discretionary review processes are difficult to scale across a full book of clients. Structural assumptions tend to be revisited only after a disappointing print, by which point price has adjusted. A more durable approach schedules the re-test: a defined cadence at which the advantage period, fade horizon, and decay indicators are reviewed against fresh evidence, independent of recent price action. Dated, written assumptions also create a defensible record of how each judgment was formed.
Conclusion
Moat erosion is an input, not a footnote. Making the competitive advantage period explicit, fading returns deliberately, and reviewing decay indicators on a schedule converts a qualitative story into something a committee can examine, challenge, and revise.
Turn Your Moat Framework Into a Rule That Runs Itself
The hard part was never the analysis. It was the follow-through, revisiting structural assumptions on schedule, across every position, while client meetings and rebalancing take priority.
That is precisely what Surmount Wealth was built to handle. Our platform lets advisors and portfolio managers turn any written thesis into a rules-based strategy that runs on top of existing brokerage accounts. No asset transfers. No code.
A hypothetical illustration. Consider an Advantage Duration Review strategy, offered purely as an illustrative concept, not a recommendation, an offering, or a representation of any actual or expected result. The concept: define a set of observable decay conditions drawn from the framework above, such as consecutive quarters of gross margin compression alongside revenue growth, and have the system surface every holding meeting those conditions for structured review on a fixed cadence rather than after a disappointing print. The rules are yours. The monitoring is automatic.
What advisors get:
A library of prebuilt strategies you can examine, screen, and test before anything touches a live account.
Custom rule construction so your own framework, not a vendor's black box, drives the logic.
Backtesting and scenario tools to study how a rule set would have behaved under different conditions.
Direct brokerage integration with your custodian and your accounts, no transfers required.
Systematic, documented execution that produces a clear audit trail of why each action occurred.
Scale without added headcount, applying the same discipline across every client portfolio.
Frameworks are only as good as the process enforcing them. Stop letting structural reviews slip between quarters.
Book a demo with Surmount Wealth →
This content is for informational and educational purposes only and should not be construed as investment advice or a recommendation to buy or sell any security. The strategy concept described is hypothetical and illustrative, does not reflect actual trading, and no performance results are represented or implied. All examples depend on assumptions that may not hold in practice. Surmount Wealth does not guarantee any outcome.
FAQ: Moat Erosion
What is moat erosion?
Moat erosion is the gradual loss of a company's competitive advantage, causing excess returns to fade toward the cost of capital.
How long do competitive advantages last?
Most converge toward industry averages within roughly a decade. A longer competitive advantage period is defensible but requires specific evidence.
What is a ROIC fade rate?
A modeling convention where returns on invested capital decline toward the cost of capital across a defined horizon rather than persisting indefinitely.
What are early moat decay indicators?
Pricing concessions, compressing gross margins alongside revenue growth, customer insourcing, and rising maintenance capex typically appear before reported results weaken.
Why do terminal value assumptions matter?
They carry most of a valuation's present value and implicitly assume advantages last forever unless moat erosion is modeled explicitly.