
Blog

Interest Expense Lag: Why Rate Hikes Aren't Fully Priced In
On September 16, the Federal Reserve raised the federal funds target range by 25 basis points to 3.75%–4.00%, its first rate increase since 2023. Markets can reprice a policy decision within hours. Income statements take much longer.
Interest expense lag is the delay between a policy rate change and its full effect on corporate interest costs. Because most companies borrow at fixed rates and refinance on staggered schedules, a hike reaches earnings gradually. For portfolio managers, that delay can open a gap between what prices reflect today and what companies report later.
What Is Interest Expense Lag?
Monetary Policy Transmission Through Corporate Balance Sheets
Research from the Federal Reserve Bank of Boston describes two main channels of monetary policy transmission through nonfinancial companies. Borrowers with variable-rate loans pay more as benchmark rates rise, and companies that refinance or issue new debt must do so at higher rates.
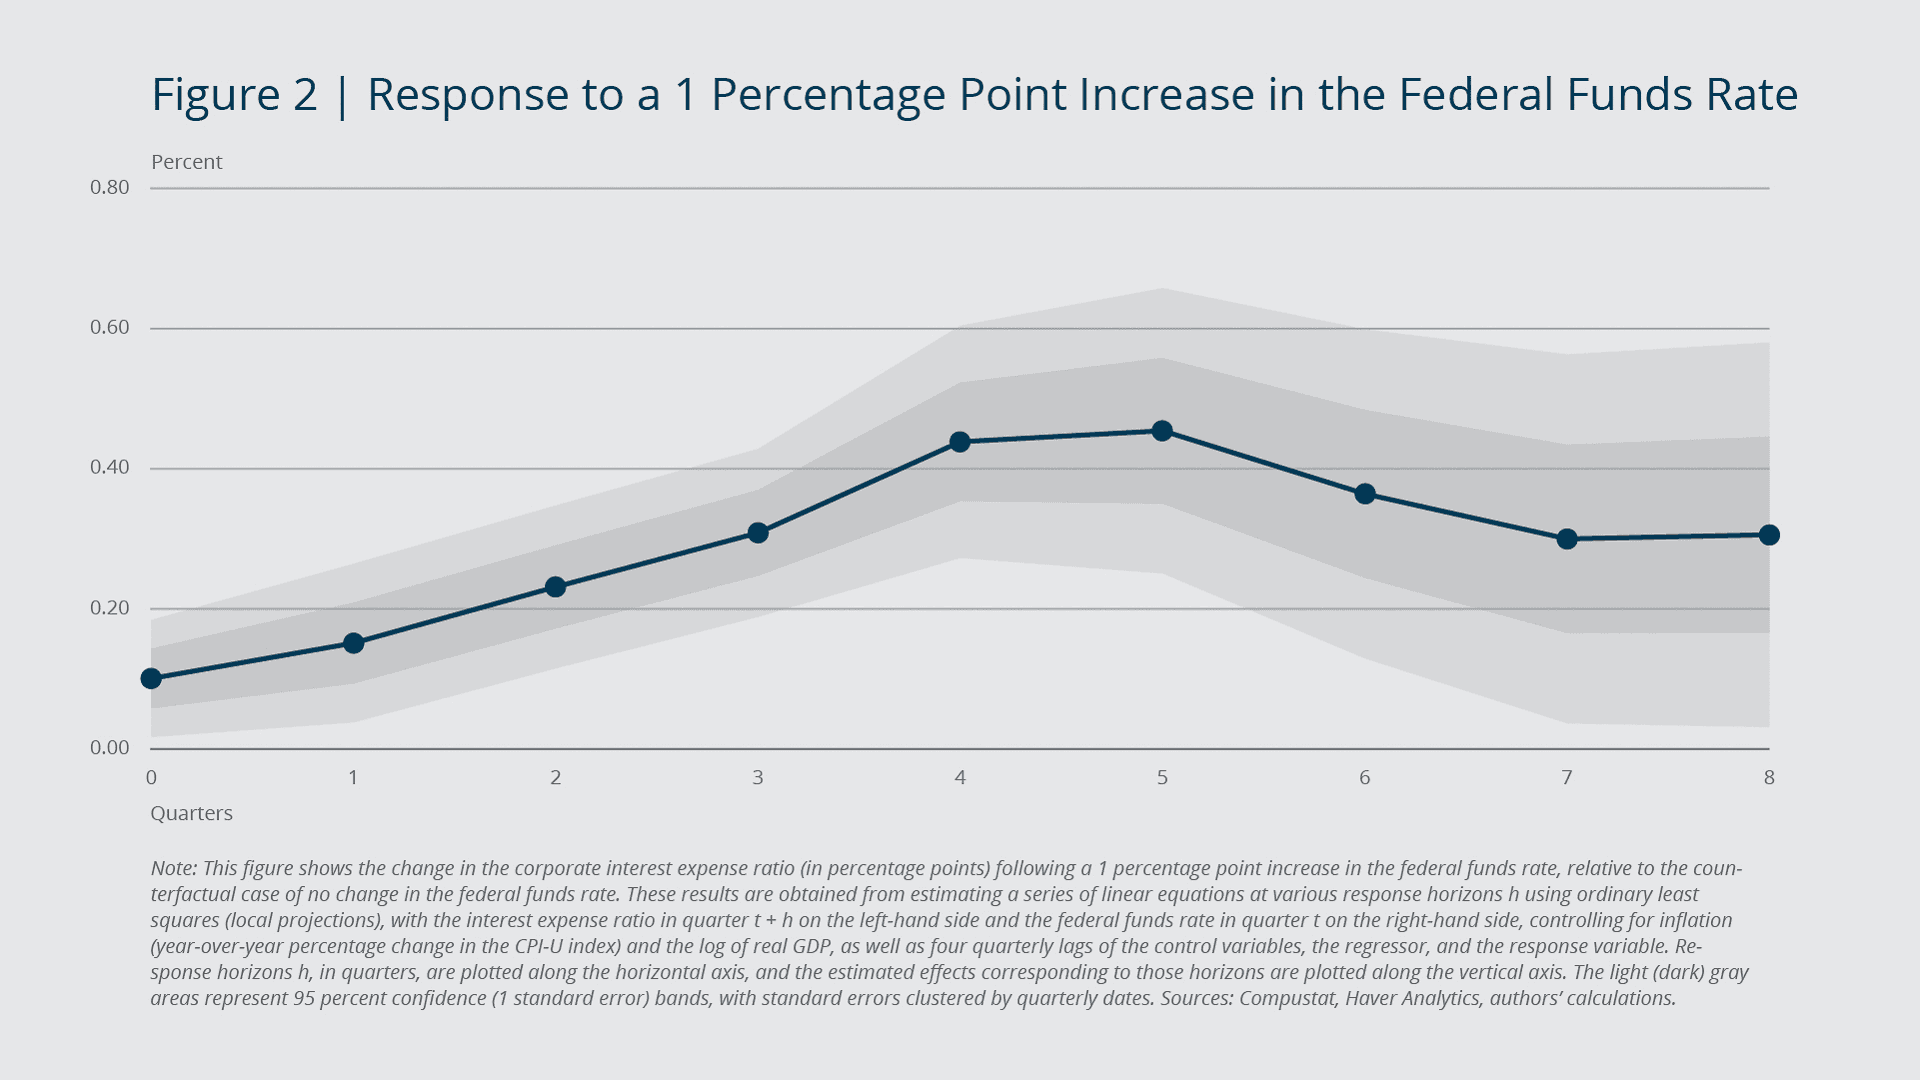
Historically, that pass-through has been partial and slow. The same analysis found that a 1 percentage point increase in the federal funds rate raised the average corporate interest expense ratio by about 0.5 percentage point, with the response peaking roughly five quarters later.
Floating-Rate Debt vs. Fixed-Rate Debt: Two Speeds of Impact
The debt mix determines how quickly a hike appears. Floating-rate debt reprices at its next reset date. Fixed-rate bonds keep their original coupon until they mature or are refinanced.
A Federal Reserve working paper cites estimates of roughly 4 to 5 years for bank loan maturities and 11 to 13 years for corporate bonds. A company that locked in long-dated funding at low rates may not feel today's hike for years, while one reliant on short-dated borrowing can feel it within a few quarters.
Why "Rate Hikes Priced In" Is an Incomplete Frame
The phrase "rate hikes priced in" usually means the expected policy path is already reflected in Treasury yields across the curve and equity valuations. That is a statement about discount rates and the cost of capital. It says little about when higher borrowing costs will reach a specific company's cash flows.
Markets move on expectations. Interest expense moves on contracts. Those two clocks rarely run at the same speed.
The Gap Between Effective Interest Rate and Market Rates
A company's effective interest rate is its interest expense divided by its debt. It reflects borrowing decisions made across many years, not current market conditions. When today's borrowing costs sit well above that blended figure, the difference represents cost increases that are delayed, not avoided. Interest expense lag lives inside that gap.
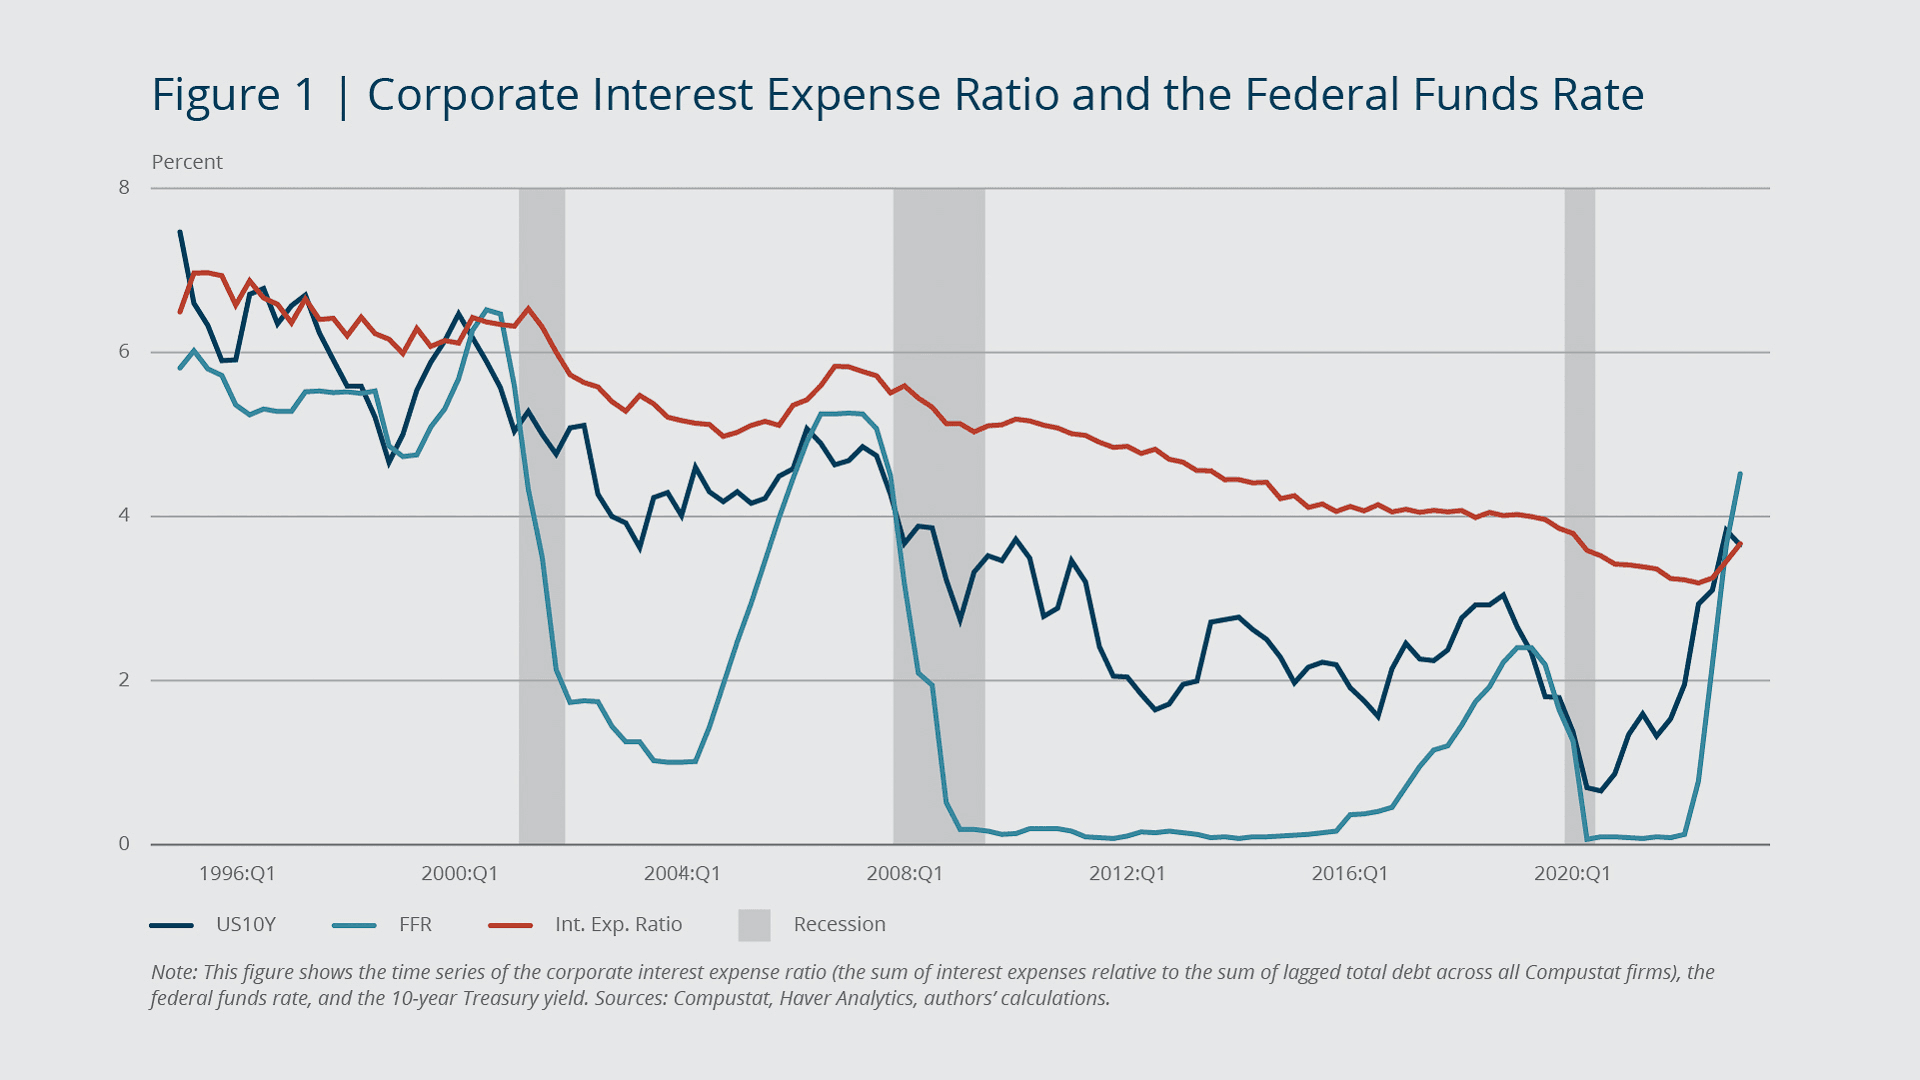
For context, a Federal Reserve Governor noted that between 2020 and 2021, the share of BBB-rated corporate bonds maturing within three years fell to its lowest level in nearly 20 years, as companies extended maturities while rates were low. That debt eventually matures and reprices.
A Three-Step Framework to Measure Refinancing Risk
Advisors can estimate refinancing risk at the holding level using public filings and a few stated assumptions.
Step 1: Read the Debt Maturity Schedule
U.S. accounting standards require companies to disclose aggregate debt maturities for each of the five years following the latest balance sheet date. The debt maturity schedule, typically found in the debt footnote of the 10-K, shows how much principal comes due and when. A practical starting metric is the share of total debt maturing within 24 months, a lens that also applies to hyperscaler debt issuance.
Step 2: Estimate the Effective Interest Rate Reset
Next, compare the coupon on maturing debt with what a similar issuer pays today, which depends on base rates and credit market conditions. Consider a hypothetical company:
Total debt: $4.0 billion, with $140 million in annual interest expense
Debt maturing within 24 months: $1.2 billion at a 3.5% coupon
Assumed refinancing rate: 6.5%
Refinancing that tranche adds about $36 million in annual pretax interest. The blended borrowing cost rises from 3.5% to 4.4%, with no change in total debt.
Hypothetical illustration only. All figures are fictional and assume constant debt levels, no hedging, and no change in credit spreads.
Step 3: Stress-Test the Interest Coverage Ratio
Then recalculate the interest coverage ratio using projected, rather than current, interest expense. If the hypothetical company generates $700 million in EBITDA, coverage falls from 5.0x to just under 4.0x. That level is meaningful: Boston Fed researchers note that firms with coverage below 4 may be deemed in distress, and typical covenant thresholds sit near 3.
Running this test across holdings shows which companies can absorb interest expense lag gradually and which face a sharper step change.
What the Lag Means for Forward Earnings Estimates
Forward earnings estimates can understate future interest costs when models carry today's blended rate forward. Two companies in the same sector can post similar margins today and very different net income two years out, based purely on their maturity profiles.
The effect extends beyond the income statement. Federal Reserve research found that corporate capital spending is more responsive to monetary policy when a higher fraction of a firm's debt matures, which can shape growth assumptions as well.
For analysts, the practical question is whether consensus models hold the interest line flat or account for scheduled refinancing, a core earnings quality question. Modeling interest expense lag explicitly helps close that gap.
Conclusion: Balance Sheet Timing Matters
A rate hike can be reflected in market prices quickly and still take years to reach reported earnings in full. Maturity schedules, variable-rate exposure, and coverage ratios reveal where that delay is longest and where it is ending.
Because interest expense lag unfolds one maturity at a time, a single review goes stale quickly, which is one reason discretionary processes are difficult to scale. Treating it as an ongoing monitoring process, rather than a one-time analysis, keeps portfolio assumptions aligned with the balance sheets underneath them.
Turn This Framework Into an Automated Strategy With Surmount Wealth
The three-step framework above works well for one holding. Repeating it every quarter, across every position in every client account, is where spreadsheets break down and refinancing signals get missed.
Surmount Wealth lets advisors and portfolio managers turn analytical frameworks like this one into automated, rules-based strategies. You can start from a library of prebuilt strategies or build custom logic around your own thesis, then connect it to existing brokerage accounts.
Hypothetical Strategy Concept: The Refinancing Pressure Monitor
For illustration only. This is not an existing Surmount Wealth strategy, has not been tested or offered, and is not a recommendation.
Here is one way the dynamics in this post could be expressed as automated rules:
Measure maturity exposure: Calculate each holding's share of total debt maturing within 24 months.
Estimate the reset: Apply an advisor-selected yield proxy, such as a corporate bond index yield, to maturing debt.
Project coverage: Recalculate each company's interest coverage ratio using projected interest expense.
Flag pressure points: Identify holdings that fall below an advisor-defined coverage threshold.
Apply predefined responses: Trigger the actions the advisor has set in advance, such as a review alert or a rule-based weight adjustment.
Key assumptions and limitations: Filing data can be outdated between reporting periods. A yield proxy may differ from the rate an individual issuer actually pays. The concept ignores hedging, early refinancing, and debt paydown from cash. Any historical testing of rules like these is hypothetical and does not predict future results.
What Surmount Wealth Offers
No asset transfers: Strategies connect to existing brokerage accounts, so assets stay where they are.
No coding required: Build and adjust strategy rules without writing code from scratch.
Prebuilt and custom strategies: Start from a strategy library or automate your own thesis, including one like the concept above.
Historical testing: Test rules against historical data before running them live, with the understanding that past data has limitations.
Consistent, repeatable execution: Rules apply the same logic every period instead of depending on manual updates.
Scalable oversight: Apply a single rule set across multiple accounts rather than rebuilding analysis account by account.
Your thesis should not depend on a spreadsheet someone remembers to update. See how your own rules could run as an automated strategy.
Book a Demo With Surmount Wealth →
Important information: This content is for educational and informational purposes only and does not constitute investment advice or a recommendation to buy, sell, or hold any security. The Refinancing Pressure Monitor is a hypothetical concept presented solely for illustration. No performance results are presented or implied. Automated and rules-based strategies involve risks, including possible loss of principal, data errors, and model limitations. Historical testing has inherent limitations and does not guarantee future results.
FAQ: Interest Expense Lag
What is interest expense lag?
Interest expense lag is the delay before a rate change fully reaches corporate interest costs, reflecting the gap between a company's effective interest rate and market rates.
Why aren't rate hikes priced in immediately?
Asset prices adjust to expected policy quickly, but interest costs follow debt contracts. Fixed-rate debt keeps its coupon until maturity, so earnings absorb hikes gradually.
How long does interest expense lag last?
It varies by company. Boston Fed research found the average response in corporate interest expenses peaked about five quarters after a rate increase.
Where is a debt maturity schedule disclosed?
Companies disclose debt maturities in the debt footnote of the 10-K, including aggregate amounts due in each of the next five years.
Who faces the most refinancing risk?
Companies with large near-term maturities, significant floating-rate debt, or a thin interest coverage ratio generally feel higher rates sooner than peers.