
Blog

Yield Curve Regime Shift: What Advisors Should Watch
The yield curve has always been one of the most closely watched signals in fixed income markets — but distinguishing routine noise from a genuine yield curve regime shift is far more difficult than headlines suggest. For advisors and portfolio managers, the challenge isn't spotting when yields move. It's determining whether that movement reflects a temporary fluctuation or a structural change in the rate environment that warrants a reassessment of portfolio positioning.
This piece outlines the core signals professionals monitor when evaluating a potential regime shift, along with the portfolio strategy considerations that typically follow.
What Is a Yield Curve Regime Shift?
A yield curve regime shift refers to a sustained change in the relationship between short- and long-term interest rates, driven by shifts in inflation expectations, fiscal conditions, or monetary policy stance — rather than short-term volatility. Unlike day-to-day rate fluctuations, a regime shift tends to persist across multiple data cycles and reflects a change in the underlying macro narrative markets are pricing in — dynamics we've examined in detail in our analysis of what the long end of the curve is signaling.
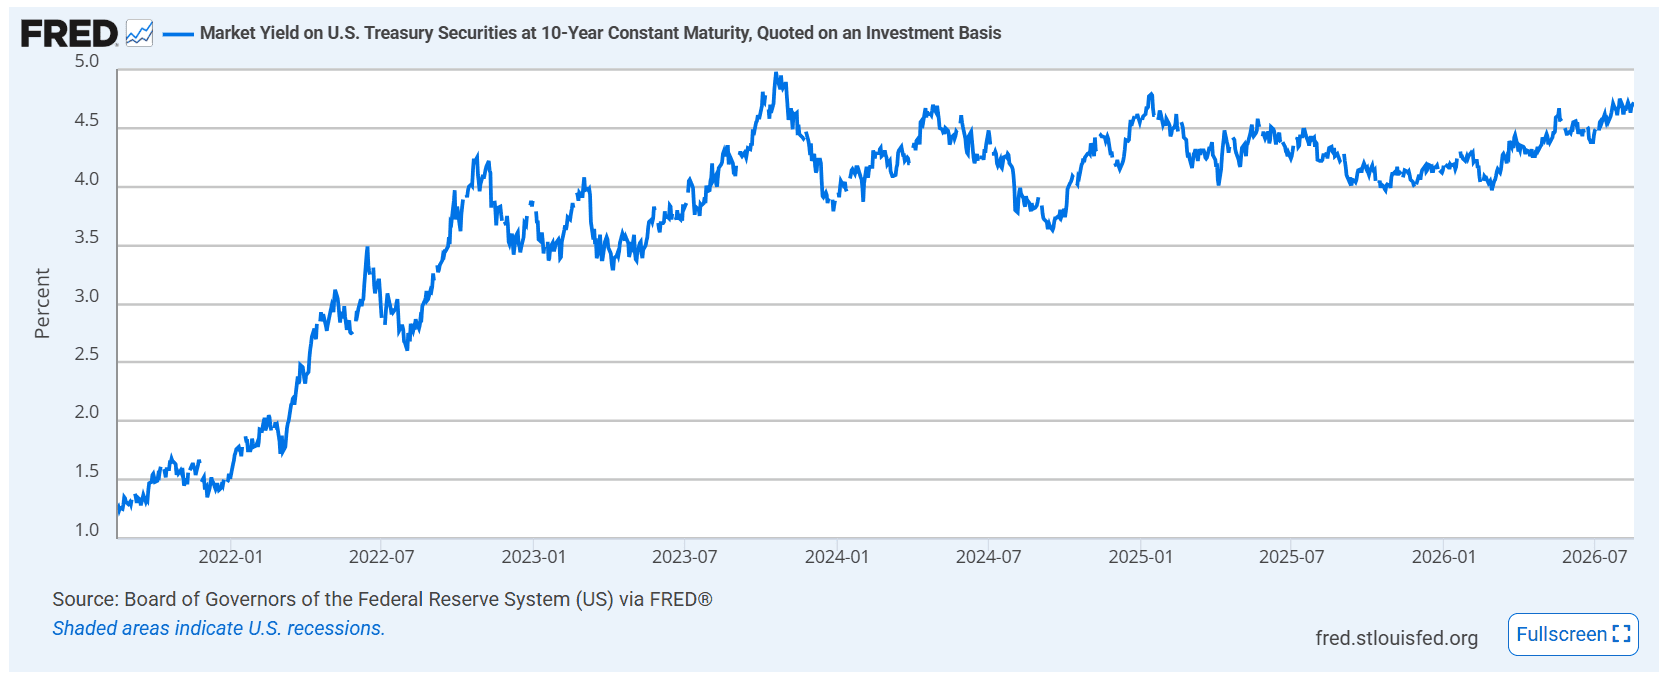
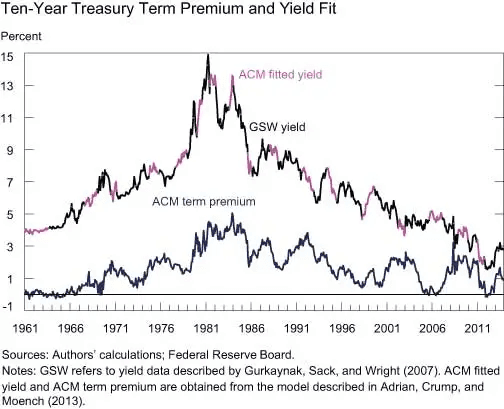
Historically, these shifts have coincided with periods of elevated Treasury issuance, changing central bank posture, or broad repricing of inflation risk. Federal Reserve research on term premium indicates that shifts in the compensation investors demand for holding longer-duration debt can meaningfully alter curve shape independent of short-rate expectations — a distinction advisors need to account for when interpreting curve movements.
Key Regime Change Signals Advisors Should Monitor
Several observable indicators tend to precede or accompany a broader shift, and integrating systematic signals into a broader risk management process can help formalize how they're tracked. Rather than reacting to any single data point, professionals typically track a combination of the following:
Sustained steepening or flattening across multiple maturities, not just a single data print
Divergence between short-end policy expectations and long-end term premium
Rising net Treasury issuance relative to historical averages
Widening spreads between government and investment-grade corporate debt
Breakeven inflation rates moving persistently away from target ranges
Yield Curve Inversion and Steepening Patterns
An inversion — where short-term yields exceed long-term yields — has historically preceded economic slowdowns, according to NBER research on the yield curve as a recession predictor, though the timing and magnitude of any subsequent effect vary considerably across cycles. A steepening move following a prior inversion is often viewed as a signal that markets are repricing growth or inflation expectations, rather than confirmation of a specific economic outcome. Advisors should treat curve shape changes as one input among several rather than a standalone predictive tool.
Term Premium and Treasury Supply Dynamics
Increased federal debt issuance can place upward pressure on long-end yields independent of Fed policy — particularly as forward guidance becomes less reliable as a positioning anchor — as markets absorb a larger supply of duration. When corporate issuance — particularly from sectors undertaking large capital expenditure programs — competes for the same investor base, term premium can rise further. SIFMA data on corporate bond issuance and Treasury auction demand metrics offer a more granular view than headline yield levels alone.
Portfolio Strategy Implications of a Regime Shift
When curve dynamics suggest a genuine regime shift rather than short-term noise, allocation considerations typically extend beyond fixed income holdings alone, given the interconnected effects on equity valuations, sector rotation, and risk budgeting.
Managing Duration Risk Across Fixed Income Allocations
Duration risk becomes a central consideration during regime transitions, since longer-duration instruments carry greater price sensitivity to rate changes — a dynamic explored further in our framework for long-duration munis in a range-bound environment. Advisors often reassess:
The overall duration profile relative to client risk tolerance and time horizon
Laddering strategies that reduce reinvestment and interest rate timing risk
Relative positioning across government, investment-grade, and high-yield credit
Rebalancing Asset Allocation for Changing Rate Environments
Asset allocation frameworks built during a prior rate regime may no longer reflect the risk-return assumptions embedded in a new one, which raises the question of how often rebalancing should occur in shifting conditions. This can prompt a review of:
Correlation assumptions between equities and fixed income
Sector exposure sensitivity to rate-driven valuation shifts
Cash and short-duration allocations relative to opportunity cost
Why Systematic Monitoring Beats Discretionary Timing
Manually tracking curve dynamics across multiple maturities, issuance data, and credit spreads is resource-intensive, and discretionary interpretation introduces behavioral bias — particularly during periods of market stress when signals are often noisiest. A systematic, rules-based approach to monitoring regime change signals can reduce reliance on subjective timing judgments and support more consistent execution across changing environments, the same challenge we've addressed in why portfolio managers benefit from systematic sell signals.
Conclusion
A yield curve regime shift rarely announces itself clearly. It typically emerges gradually, through a combination of curve shape changes, term premium movement, and issuance dynamics that compound over time. For advisors, the goal isn't predicting the exact turning point — it's building a monitoring framework robust enough to separate signal from noise and a portfolio strategy flexible enough to adapt when the evidence warrants it.
This article is for informational purposes only and does not constitute investment advice or a recommendation to buy or sell any security.
Explore This Thesis as an Automated Strategy
Monitoring yield curve regime shifts manually — across maturities, issuance data, term premium, and credit spreads — is exactly the kind of ongoing, multi-signal tracking that lends itself to systematic automation. With Surmount Wealth, advisors and portfolio managers can build, test, and automate rules-based strategies that respond to macro signals like these without needing to code from scratch or move assets away from an existing brokerage account.
Hypothetical Illustration Only — Not a Live or Backtested Strategy
As an example of how this kind of thesis could be structured systematically, consider a hypothetical framework built around regime-shift monitoring:
Signal inputs: Track curve steepening/flattening across key maturities alongside term premium and net Treasury issuance data
Trigger logic: Define rules-based thresholds that flag a potential regime change rather than reacting to single-day moves
Response actions: Pre-set adjustments to duration exposure or fixed income allocation weights when trigger conditions are met
Review cadence: Automated, periodic reassessment of thresholds as new data becomes available
This is a hypothetical construct intended solely to illustrate how a systematic framework could be organized — it is not a recommendation, is not backtested, and does not reflect any specific Surmount strategy performance.
Why advisors consider building strategies like this on Surmount:
Access professional-grade, rules-based strategy libraries or build fully custom logic
Automate execution on top of your existing brokerage account — no fund transfers required
Remove manual monitoring burden for multi-signal, data-intensive theses
Test strategy logic before applying it to client portfolios
Maintain full transparency and control over strategy rules at every step
If you're interested in exploring how a systematic, rules-based approach could support your own macro or fixed income frameworks, we invite you to book a demo and test what automation could look like for your practice.
FAQ: Yield Curve Regime Shift
What causes a yield curve regime shift?
A regime shift typically stems from sustained changes in inflation expectations, fiscal policy, or Treasury issuance rather than short-term rate moves.
How is a regime shift different from volatility?
Volatility is short-term and often reverses, while a regime shift reflects a sustained, structural change in rate dynamics.
Does yield curve inversion always predict recession?
Historically inversion has often preceded slowdowns, but timing and magnitude vary considerably and it isn't a standalone predictor.
How often should advisors monitor curve signals?
Many practitioners track curve shape, term premium, and issuance data continuously rather than on a fixed periodic basis.
Can duration risk be managed systematically?
Yes — rules-based frameworks can apply consistent thresholds to duration and asset allocation decisions as conditions change.