
Blog
Why Interest Rate Forecasts Fail: A Guide for Advisors
Every few weeks, a major bank publishes a new yield target, and within days a client asks whether it makes sense to wait for rates to peak before adjusting anything. It is a reasonable question. It is also one that interest rate forecasts have a poor record of answering.
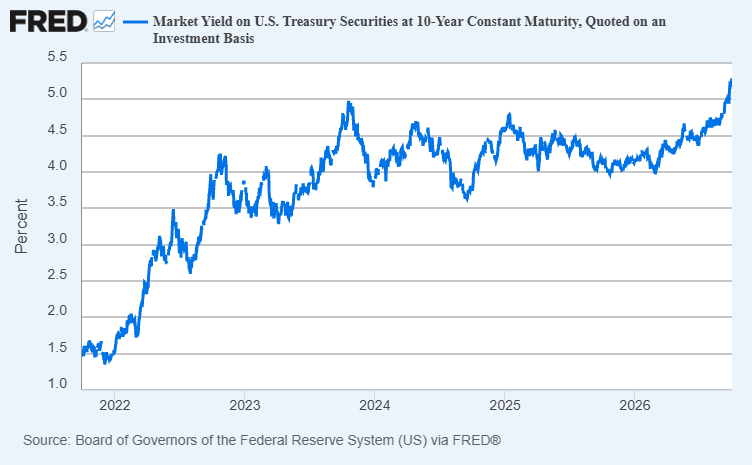
In mid-September 2026, the 10-year Treasury yield sat near 5%, according to FRED data, and the debate over where it goes next is louder than ever. For advisors, the more useful question is not where rates are headed, but how to build portfolios that do not depend on getting that call right.
What the Track Record Shows on Interest Rate Forecasts
The evidence comes from two places: the policymakers closest to the decision and the markets that price it. Neither offers the certainty that client conversations often assume.
Fed Dot Plot Accuracy vs. Realized Rates
The Fed's own projections illustrate the problem. In December 2021, the median FOMC participant projected a federal funds rate of 0.9% for the end of 2022. By December 2022, the Committee had raised its target range to 4.25%–4.50%.
This was not an isolated miss. Each Summary of Economic Projections includes historical error bands drawn from private and government forecasts. In the same December 2021 release:
The average error for short-term rate projections was roughly ±1.5 percentage points in the second year.
By the fourth year, that range widened to about ±2.5 percentage points.

A 2026 Federal Reserve working paper adds nuance. It finds that dot plot projections have produced lower errors than consensus surveys and several market-based measures at many horizons, but also that they can anchor expectations and slow how quickly new information gets priced. Even the best available forecast still carries wide error bands.
What Fed Funds Futures Get Right and Wrong
Market-implied forecasts are the usual alternative. In a San Francisco Fed working paper, Gürkaynak, Sack, and Swanson found that fed funds futures outperformed other market-based measures at horizons out to six months, with errors growing as horizons lengthened.
Two further limitations matter for portfolio decisions:
Risk premia distort the signal. Piazzesi and Swanson show that ignoring time-varying risk premia can produce substantial errors when reading policy expectations from futures prices.
Errors cluster at turning points. New York Fed analysis finds private-sector forecast errors tend to be largest when the funds rate is changing most, which is exactly when positioning matters.
Long-term interest rate forecasts are harder still. Research summarized in Cogent Economics & Finance reports that professional forecasters have generally failed to beat a simple random-walk benchmark, which assumes today's yield persists, for long-term Treasury rates.
How Forecast Errors Turn Into Duration Risk
A missed forecast becomes a portfolio problem only when positioning depends on it. That dependence usually shows up as concentrated duration risk.
FINRA offers a standard rule of thumb: a bond with a duration of 10 would be expected to decline roughly 10% in price if rates rose one percentage point. Now consider how a single rate call can compound across a client portfolio:
Extending bond duration in anticipation of cuts
Overweighting REITs, utilities, and other income equities that trade as bond proxies
Holding long-dated growth equities whose valuations are sensitive to discount rates
Each position may look reasonable on its own. Together, they amount to one large bet on interest rate forecasts that, on the evidence above, carry wide error bands.
Portfolio Construction Without a Rate Call
The alternative is not to ignore rates. It is to replace predictions with observable conditions and pre-committed responses.
Define the Rate Regime, Not the Destination
Instead of asking where yields will be in 12 months, define the current rate regime using data that is already visible:
Trend: Is the 10-year yield above or below its long-term moving average?
Curve shape: Is the yield curve inverted, flat, or steepening?
Volatility: Is realized rate volatility elevated relative to its history?
These signals describe conditions as they are, not as someone expects them to become. The portfolio responds when conditions change, not when a new forecast is published.
Interest Rate Risk Management Through Pre-Set Ranges
Effective interest rate risk management starts with boundaries set in advance, typically documented in the investment policy statement:
Set a target duration band for fixed income rather than a single point estimate.
Cap aggregate exposure to rate-sensitive equities as a share of the total portfolio.
Define which conditions permit movement toward each end of the band.
Ranges acknowledge uncertainty directly. They allow adjustment without requiring conviction about the next Fed meeting.
Systematic Rebalancing as the Execution Layer
Rules only help if they are applied consistently. Systematic rebalancing turns the framework into repeatable action:
Rebalance when allocations drift beyond set thresholds, not when headlines shift.
Log each adjustment against the rule that triggered it.
Review the rules periodically rather than second-guessing individual trades.
The result is an audit trail that supports compliance documentation and client reporting.
Why Rules-Based Investing Fits a Market Nobody Can Forecast
Rules-based investing does not claim to know where rates are going. Its value is procedural:
Consistency: The same conditions produce the same response across every client account.
Discipline: Pre-committed rules reduce recency bias and the pull to react to the latest yield target.
Transparency: Advisors can explain exactly why a portfolio changed and point to the rule behind it.
Scalability: One framework can be applied across many households without manual rework.
For firms fielding constant questions about Fed policy, that consistency can matter more to the client relationship than any single rate call.
Conclusion
Interest rate forecasts will keep making headlines, and some will occasionally be right. The evidence suggests advisors should not build client portfolios around them. Defining conditions from observable data, setting ranges in advance, and executing through rules shifts the conversation from "Where will rates go?" to "How will we respond?" That is a question advisors can actually answer.
Turn Your Rate Framework Into an Automated Process With Surmount Wealth
A rules-based rate framework is only as good as its execution. Applied manually across dozens or hundreds of client accounts, even the clearest rules drift. Surmount Wealth closes that gap by turning your process into automated strategies that run on your existing brokerage accounts.
Why advisors and portfolio managers use Surmount:
Automate any thesis. Codify your own rules, including a rate-regime framework like the one above, without writing code.
Start from a strategy library. Browse prebuilt, professional-grade strategies and customize them to your firm's process.
Test before you commit. Evaluate rules against historical data to understand how they would have behaved. Backtested results are hypothetical and do not predict future results.
Keep assets where they are. Surmount connects to existing brokerage accounts, so no asset transfers are required.
Scale with consistency. Apply one rule set across many client accounts, with automated rebalancing.
Document every decision. Each adjustment ties back to the rule that triggered it, supporting compliance review and client reporting.
Hypothetical Strategy Concept: The Rate Regime Duration Rotator
For illustration only. This is an idea, not an existing Surmount strategy.
Here is one way the ideas in this article could be translated into automated rules:
Read the regime using three observable signals: the 10-year Treasury yield relative to its 200-day moving average; the slope of the 2s10s yield curve; and 20-day realized volatility of daily yield changes compared with its one-year median.
Rising-rate regime (yield above its moving average, volatility normal): tilt fixed income toward the shorter end of a pre-set duration band.
Falling-rate regime (yield below its moving average, volatility normal): tilt toward the longer end of the band.
Mixed or high-volatility signals: hold at the band's midpoint, with a portion in cash equivalents.
Rebalance monthly, or whenever any sleeve drifts more than 5 percentage points from its target.
Important disclosure: The Rate Regime Duration Rotator is a hypothetical, illustrative concept created for educational purposes. It has not been backtested or traded, and no performance, actual or hypothetical, is presented or implied. The concept assumes timely data availability and does not account for transaction costs, taxes, liquidity, or client-specific suitability. It is not a recommendation to buy, sell, or hold any security or to adopt any strategy. Any strategy built on these ideas would require independent due diligence and suitability and compliance review. This content is for informational purposes only and should not be taken as investment advice.
See It in Action
Your firm already has views on how to respond to rate conditions. Surmount lets you put those rules into a system that runs consistently, every time, across every account.
[Book a Demo →] and see how your rate framework can be built, tested, and automated on Surmount.
FAQ: Interest Rate Forecasts
Why do interest rate forecasts fail?
Rates react to economic shocks that no model can anticipate. Even the Fed's own historical error bands reach about ±2.5 percentage points four years out.
How accurate is the Fed dot plot?
A 2026 Fed working paper found the dot plot often outperforms consensus surveys. Its errors still widen considerably beyond the current year.
What do fed funds futures predict?
They reflect the market-implied path of the policy rate. Research finds they are most informative at horizons out to about six months.
How do advisors manage interest rate risk?
Common approaches include setting duration ranges in advance, defining the current rate regime from observable data, and using systematic rebalancing to act consistently.
What is rules-based investing?
It is an approach in which pre-set, documented rules drive portfolio changes instead of forecasts. It emphasizes consistency and auditability but does not guarantee results.