
Blog

Is Value Investing Dead? What the Factor Research Says
Few debates in factor investing have run as long as this one. After more than a decade of growth leadership, commentators keep asking the same question: is value investing dead? For portfolio managers and advisors who oversee systematic tilts, the question is practical. It shapes how value exposure is defined, measured, and explained to clients, especially after long stretches when one style has led.
The research offers a more nuanced answer than the headlines. Much of what looks like the failure of value may instead be a failure of how value is measured.
Value vs Growth Stocks: What the Long-Run Data Shows
The academic case for value rests on decades of evidence. Eugene Fama and Kenneth French formalized the value effect in their 1993 three-factor model, and the Kenneth French Data Library publishes factor return data back to 1926.
The recent record has been difficult. Arnott, Harvey, Kalesnik, and Linnainmaa found that the Fama-French value factor lagged growth from 2007 onward, reaching a 55% drawdown by mid-2020. Lev and Srivastava went further, concluding that a long-short value strategy had been largely unprofitable for close to three decades, apart from a short revival after the dot-com collapse.
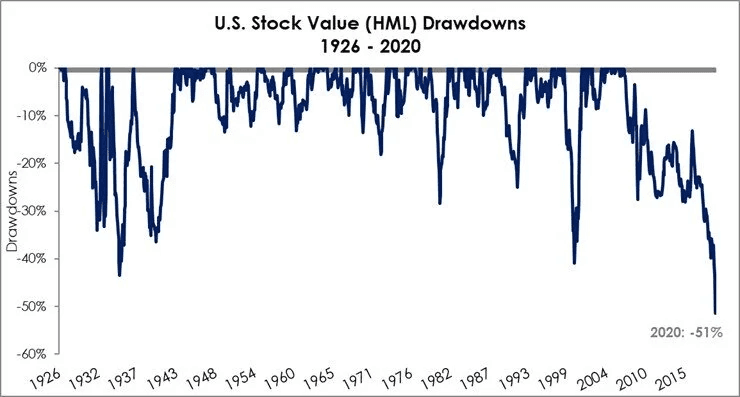
Historical factor returns are cited for research context only. Past performance does not guarantee future results.
So the debate over value vs growth stocks is not about whether value struggled. It did. The real question is why.
Defining the Value Premium in Factor Investing
The value premium is the historical return gap between cheap and expensive stocks. But "cheap" needs a definition, and small methodological choices can change the results materially.
How the HML Factor Is Constructed
The HML factor (High Minus Low) takes the average return of two value portfolios and subtracts the average return of two growth portfolios, with stocks sorted on size and book-to-market. Much of the published evidence on value traces back to this construction.
A few features worth noting:
Single-metric sort: It sorts on one measure, book-to-market.
Value-weighted: It uses value-weighted portfolios, a construction choice that matters for many of the same reasons as the equal-weight vs. cap-weight debate.
Long-short structure: This makes direct comparisons with long-only value mandates imperfect.
Why the Book-to-Market Ratio Matters
The book-to-market ratio compares accounting book equity with market capitalization. It served as a reasonable proxy for cheapness in an economy built on physical assets. Like any single valuation measure, including the CAPE ratio, it has blind spots. Its weakness is that book value records what a company has capitalized on its balance sheet, not necessarily the economic capital it has built.
Four Explanations for Value's Struggles
Researchers have tested several hypotheses, and each has different implications for the question: is value investing dead?
Intangible Assets and Value Measurement
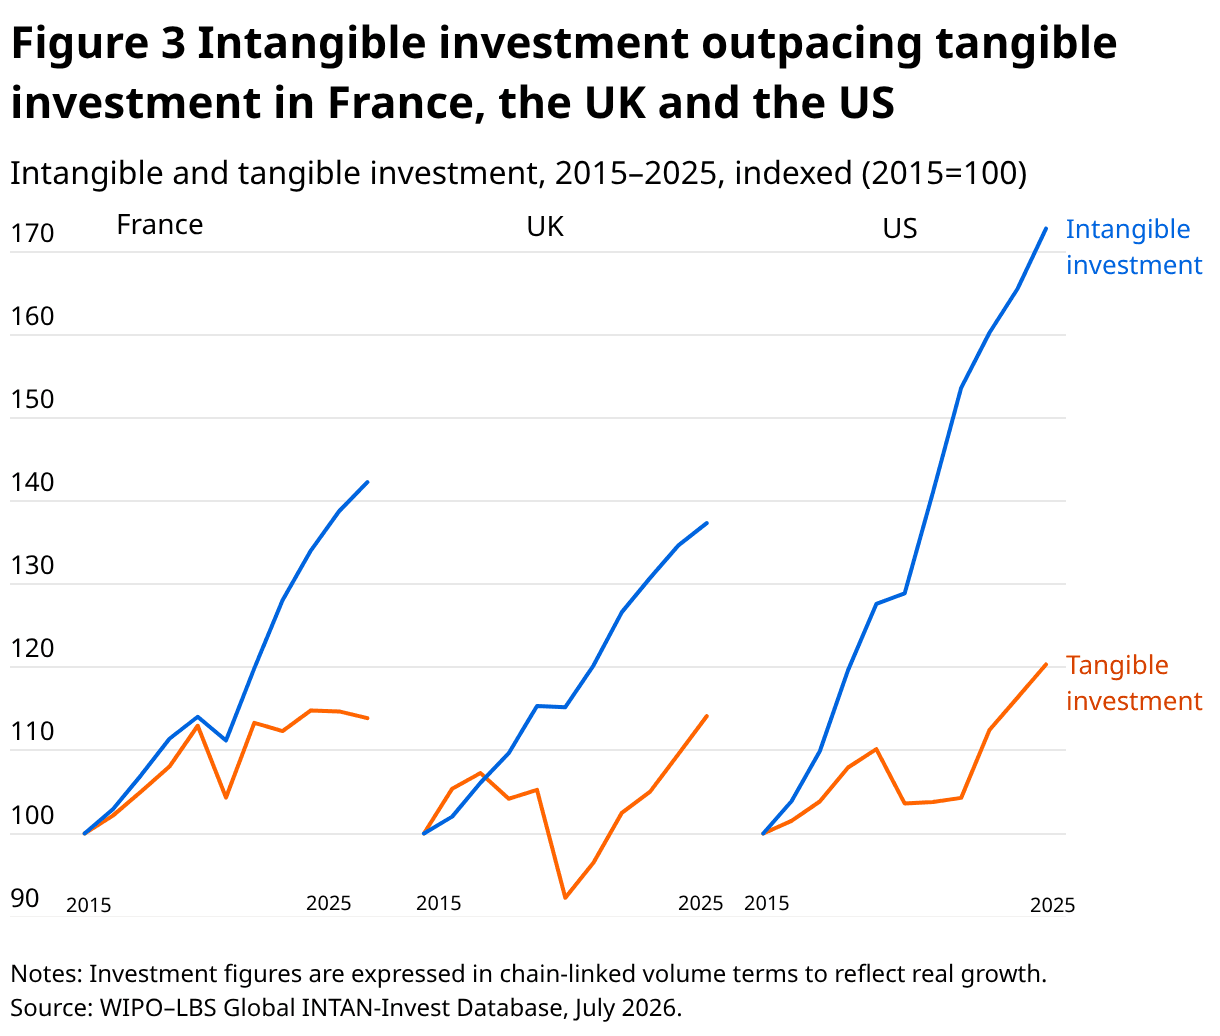
The first explanation concerns the link between intangible assets and value measurement. Accounting rules require most spending on R&D, brands, and software to be expensed rather than capitalized. As intangibles have grown, book value understates the capital base of many firms. Lev and Srivastava attribute much of value's weakness to accounting deficiencies that misclassify value and growth stocks, a reminder that the scrutiny applied in earnings quality analysis applies to balance sheets too. Arnott et al. capitalized intangibles and found the adjusted measure historically outperformed the traditional definition by a wide margin in their research sample.
Interest Rates and Equity Duration
A popular theory holds that falling rates favored long-duration growth stocks. The evidence is weaker than the narrative. Maloney and Moskowitz found only modest links between rates and value's performance, and those links varied by specification and did not hold up across other samples.
Factor Crowding and Arbitrage
Once a return pattern is published, capital can compete it away. McLean and Pontiff studied 97 published return predictors and found portfolio returns 26% lower out-of-sample and 58% lower after publication. Factor crowding is a plausible drag on value, and Arnott et al. list it among five candidate explanations, alongside data mining, structural change, cheapening valuations, and bad luck.
The Value Spread at Historical Extremes
The value spread measures how expensive growth stocks are relative to value stocks. Arnott et al. found that changes in this spread accounted for the entire drawdown in their analysis. At the time of their study, growth stocks traded at nearly 12 times the price-to-book of value stocks, a level approached only twice in 57 years: at the dot-com peak and the financial-crisis trough.
A wider spread suggests returns were driven by revaluation rather than proof that the premium disappeared. It does not indicate when, or whether, the spread will narrow.
So, Is Value Investing Dead? A Practitioner's View
The research does not settle the debate, but it reframes it. Instead of asking is value investing dead, a more useful question may be which definition of value, measured how, and in which part of the market.
Questions a portfolio manager might consider:
Which value metric does our process rely on, and does it account for intangibles?
How does our value exposure look under composite measures such as earnings, cash flow, and sales, or growth-adjusted metrics like the PEG ratio, rather than book-to-market alone?
Is the strategy long-only or long-short, and how does that affect comparisons with academic factor returns?
How do results change across different lookback windows and sector constraints?
These questions are empirical. They can be tested rather than argued.
Conclusion
Is value investing dead? The evidence reviewed here points to a more complicated picture: a factor weighed down by an aging accounting definition, a historically wide value spread, and possible crowding, rather than a premium proven to have vanished. None of this predicts future results. It does suggest that advisors who define value precisely, and test those definitions systematically, are better placed to evaluate the evidence as it develops.
Turn Factor Research into Testable Rules with Surmount
The value debate has lasted this long partly because few practitioners get to test the definitions they rely on. Surmount Wealth is built to close that gap.
Surmount is an AI-driven platform that lets advisors and portfolio managers build, backtest, and automate rules-based strategies directly on existing brokerage accounts, with no asset transfers and no coding. You can start from a library of prebuilt strategies, or turn your own thesis into a custom automated strategy. That includes a value framework like the one discussed above.
Hypothetical strategy concept: Intangible-Adjusted Value Composite
This is an illustrative idea only. It is not a live strategy, it has not been backtested, and it is not a recommendation.
Universe: US large- and mid-cap equities.
Value score: A composite of earnings yield, free cash flow yield, and an intangible-adjusted book-to-market measure that capitalizes R&D.
Quality filter: Excludes the lowest profitability quintile to limit exposure to structurally declining businesses.
Weighting: Sector-neutral, to reduce unintended sector bets.
Rebalancing: Quarterly, with the value spread tracked as a context metric rather than a timing signal.
Assumptions and limitations: All parameters are arbitrary and chosen for illustration. Actual outcomes would depend on data quality, transaction costs, taxes, and implementation. Any backtest of this concept would be hypothetical and subject to inherent limitations.
What Surmount offers:
No asset transfers: Strategies connect to the brokerage accounts your clients already hold.
No code required: You build rules through the platform instead of scripting them from scratch.
Side-by-side testing: You can compare competing value definitions before anything is automated.
Automated rebalancing: Rules run consistently, which reduces manual workload.
Prebuilt or custom: You can start from the strategy library or build around your own thesis.
Built to scale: The same process can be applied across many client accounts.
See how your value thesis could look as a testable, automated rule set. Book a demo with Surmount today →
Disclosure: The strategy described above is hypothetical and provided for illustrative and educational purposes only. It does not represent an actual account, product, or recommendation, and no performance results are presented or implied. Backtested and hypothetical results have inherent limitations and do not reflect actual trading. This content is not investment advice. Past performance does not guarantee future results. All investing involves risk, including possible loss of principal.
FAQ: Is Value Investing Dead
Is value investing dead?
The research doesn't show that value investing is dead. Arnott et al. attribute the 2007–2020 underperformance to how value is measured and to a widening value spread.
What is the HML factor?
The HML factor is the Fama-French value factor. It is the return of value portfolios minus growth portfolios, with stocks sorted by size and book-to-market ratio (Kenneth French).
Why has the value premium weakened?
Leading explanations include intangible assets missing from book value, factor crowding, and valuation gaps. Interest rates show only modest links.
How does factor crowding affect returns?
Published return patterns attract capital. McLean and Pontiff found that returns for the predictors they studied were 58% lower after publication.
Where can advisors find value factor data?
The Kenneth French Data Library publishes free HML and other factor return data, with monthly series going back to 1926.