
Blog

Macro Risk Exposure: A Holding-Level Framework for Advisors
Every market cycle arrives with its own list of macro worries. Today that list includes elevated fuel costs, firm interest rates, rising industrial metal prices, and stretched valuations. The harder question for advisors and portfolio managers is which holdings actually carry those risks, and by how much.
Macro risk exposure is the degree to which a security's revenue, costs, financing, or valuation responds to changes in broad economic variables such as inflation, interest rates, commodity prices, and currency moves. Measuring it position by position turns a vague worry list into something an investment committee can document, discuss, and monitor.
Below is a four-step framework for doing that, plus its key limitations.
Why Holding-Level Exposure Matters
Portfolio-level views often average away what matters most. Two companies in the same index can respond to the same macro shock in opposite directions.
Consider three illustrative archetypes:
A freight-heavy industrial: Diesel is a direct operating cost, so fuel spikes can compress margins unless customer contracts include surcharges.
A net-cash software company: Higher rates may lift interest income, while revenue has little direct link to commodity prices.
A highly levered consumer business: Rising financing costs and softer demand can arrive together when household budgets tighten.
Sector weights might treat these as similar; holding-level exposure analysis does not. That is the core reason to assess macro risk exposure one position at a time before drawing portfolio-wide conclusions.
A Four-Step Framework for Portfolio Risk Mapping
Portfolio risk mapping connects each macro variable to each holding through a defined transmission channel, then measures and aggregates the result.
Step 1: Identify Channels Like Input Cost Inflation
Start by asking how a macro variable reaches a company's financial statements. Most effects travel through four channels:
Costs: Input cost inflation in fuel, metals, labor, or freight.
Demand: Shifts in consumer or business spending.
Financing: Borrowing costs and refinancing needs.
Currency: Translation and competitive effects from dollar moves.
For input cost inflation, two questions matter most: how large the input is relative to cost of goods sold, and whether the company can pass higher costs through to customers. Segment disclosures and risk factor sections in annual 10-K filings on SEC EDGAR are a practical starting point.
Step 2: Quantify Macro Factor Sensitivity
Next, estimate macro factor sensitivity for each holding. A common approach regresses a security's returns against changes in macro variables, producing a beta to each factor. This builds on academic work such as Chen, Roll, and Ross (1986), which tested whether variables including industrial production, inflation, and credit spreads help explain stock returns.
Statistical betas should be paired with fundamental checks:
Revenue mapping: What share of sales comes from cyclical or commodity-linked end markets?
Cost mapping: What share of expenses is tied to the input in question?
Balance sheet mapping: How much debt is floating-rate or maturing soon?
Where statistical and fundamental evidence conflict, document the disagreement.
Step 3: Run Scenario Analysis for Portfolios
Betas describe average behavior. Scenario analysis for portfolios shows how holdings might respond under specific, defined shocks. Two approaches work well together:
Historical scenarios replay a past episode, such as the 2022 rate-and-inflation shock, against current holdings.
Hypothetical scenarios define a forward shock, such as a sustained rise in diesel prices combined with a 100-basis-point move in the 10-year Treasury yield.
The Federal Reserve's annual supervisory stress test scenarios offer a useful template, specifying paths for rates, spreads, and asset prices. Outputs are estimates, not forecasts.
Step 4: Aggregate Through Factor Exposure Analysis
Finally, roll holding-level results up through factor exposure analysis. Weighting each position's sensitivities by its portfolio weight shows net macro risk exposure to each factor.
This step typically surfaces:
Hidden concentrations: Several unrelated names share a single sensitivity.
Natural offsets: Some holdings benefit from a shock that hurts others.
Policy gaps: Differences between the risk profile described in the investment policy statement and the actual one.
Where Interest Rate Sensitivity Hides
Interest rate sensitivity is often the most uneven exposure in large-cap portfolios, and headline debt figures mislead. A company with a thin equity base, frequently the result of debt-funded buybacks, may report a very high return on equity while carrying meaningful refinancing risk. A company holding net cash may be largely insulated.
Three checks help separate the two:
Interest coverage: Operating income relative to interest expense.
Maturity schedule: How much debt must be refinanced over the next few years, and at what rates relative to current coupons.
Floating-rate share: Debt that reprices quickly when policy rates move.
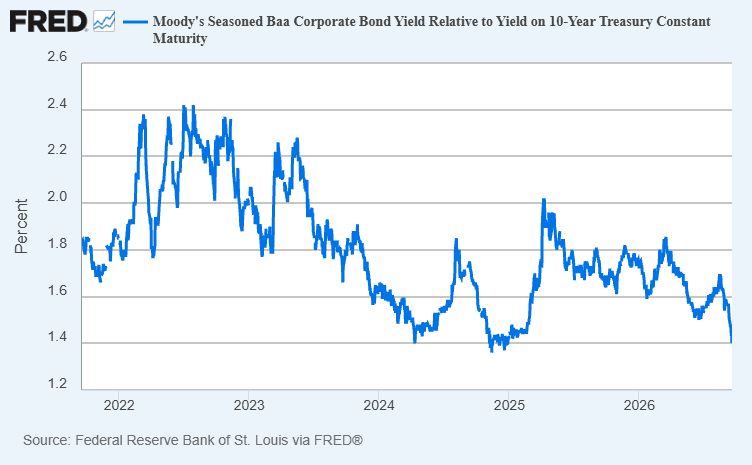
Treasury yield and corporate credit spread data are publicly available through the St. Louis Fed's FRED database.
Limitations Every Advisor Should Acknowledge
No mapping framework removes uncertainty. Keep these limits in view:
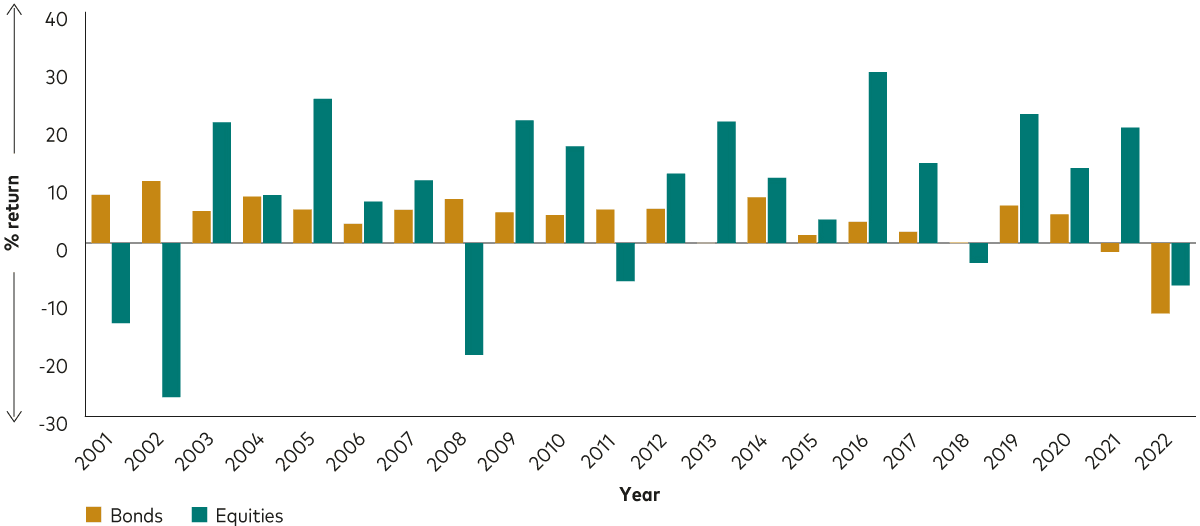
Correlations shift. Relationships can reverse after a regime shift, as when stocks and bonds fell together in 2022.
Data lags. Disclosures arrive quarterly; macro conditions change daily.
Second-order effects are hard to model. A fuel shock can move demand, rates, and currencies at once.
Past sensitivity is not predictive. Exposure estimates support judgment; they do not replace it or prevent losses.
From Spreadsheets to Rules-Based Risk Monitoring
Mapping one portfolio in a spreadsheet is manageable. Maintaining that map across hundreds of client accounts, and refreshing it as conditions change, is where manual processes break down.
Rules-based risk monitoring addresses the scaling problem. Once exposure thresholds are defined, such as a maximum net sensitivity to energy prices or a minimum interest coverage ratio for any single position, they can be checked systematically. Alerts flag breaches for review, while the final decision stays with the advisor.
Conclusion
The value of measuring macro risk exposure is that it replaces debate about whether a risk matters with evidence about where it sits. By identifying channels, quantifying sensitivity, running scenarios, and aggregating results, advisors can build a documented, repeatable process for reviewing macro risk exposure and explaining it to clients and committees.
Turn Your Macro Framework Into an Automated Process With Surmount Wealth
The framework above is only as useful as your ability to apply it consistently. Surmount Wealth helps advisors and portfolio managers turn processes like this one into rules that run automatically, directly on top of existing brokerage accounts.
What Surmount Wealth offers:
Prebuilt strategy library: Start from professionally designed, rules-based strategies instead of a blank page.
Custom strategies without code: Translate your own thesis, including exposure thresholds and screening rules, into an automated strategy.
Backtesting before you commit: Test how rules would have behaved historically so you understand their mechanics and trade-offs.
No asset transfers: Connect existing brokerage accounts, so there's no need to move client funds.
Consistency at scale: Apply the same rules across many accounts, with the final decision still in your hands.
A hypothetical idea: the "Macro Exposure Guardrail"
The following is a hypothetical, illustrative concept only. It is not an existing Surmount strategy, has not been backtested, and is not a recommendation.
Monthly refresh: Recalculate each holding's estimated sensitivity to three macro factors: crude oil prices, the 10-year Treasury yield, and the trade-weighted U.S. dollar.
Balance sheet filter: Flag any position whose interest coverage falls below an advisor-set floor.
Exposure ceiling: If net portfolio sensitivity to any single factor exceeds a predefined threshold, generate an alert and a proposed rebalance toward target weights for advisor review.
Human in the loop: No trade executes without advisor approval.
Assumptions and limitations: This concept assumes historical sensitivities remain reasonably stable, which may not hold during regime shifts. Estimates depend on data quality, lookback periods, and model choices. The concept may lag fast-moving events, cannot prevent losses, and would involve trading costs and possible tax consequences.
See how your process could run on autopilot.
[Book a demo with Surmount Wealth today]
Disclosure: This content is for informational and educational purposes only and does not constitute investment, legal, or tax advice, or a recommendation to buy or sell any security or adopt any strategy. The hypothetical strategy described is illustrative, has not been backtested, and does not reflect actual trading or results. All strategies involve risk, including possible loss of principal. Past performance does not guarantee future results.
FAQ: Macro Risk Exposure
What is macro risk exposure?
Macro risk exposure is how much a holding's revenue, costs, financing, or valuation responds to changes in inflation, interest rates, commodities, and currencies.
How do advisors measure macro factor sensitivity?
A common approach combines regression betas to macro variables with fundamental revenue, cost, and debt mapping. Scenario analysis for portfolios then tests the results.
Why does holding-level exposure matter?
Portfolio averages can hide concentrations. Holding-level exposure analysis shows which positions actually carry a given macro risk, and by how much.
When should portfolio risk mapping be updated?
Refreshing it each review cycle and after major macro shocks keeps it relevant, since sensitivities shift as regimes, earnings, and balance sheets change.
Who benefits from rules-based risk monitoring?
Advisors and portfolio managers overseeing many accounts benefit most. Predefined thresholds and alerts help apply one process consistently, while final decisions stay with the advisor.