The Midterm Election Stock Market Effect Explained

The Midterm Election Stock Market Effect Explained
What Is the Midterm Election Stock Market Effect?
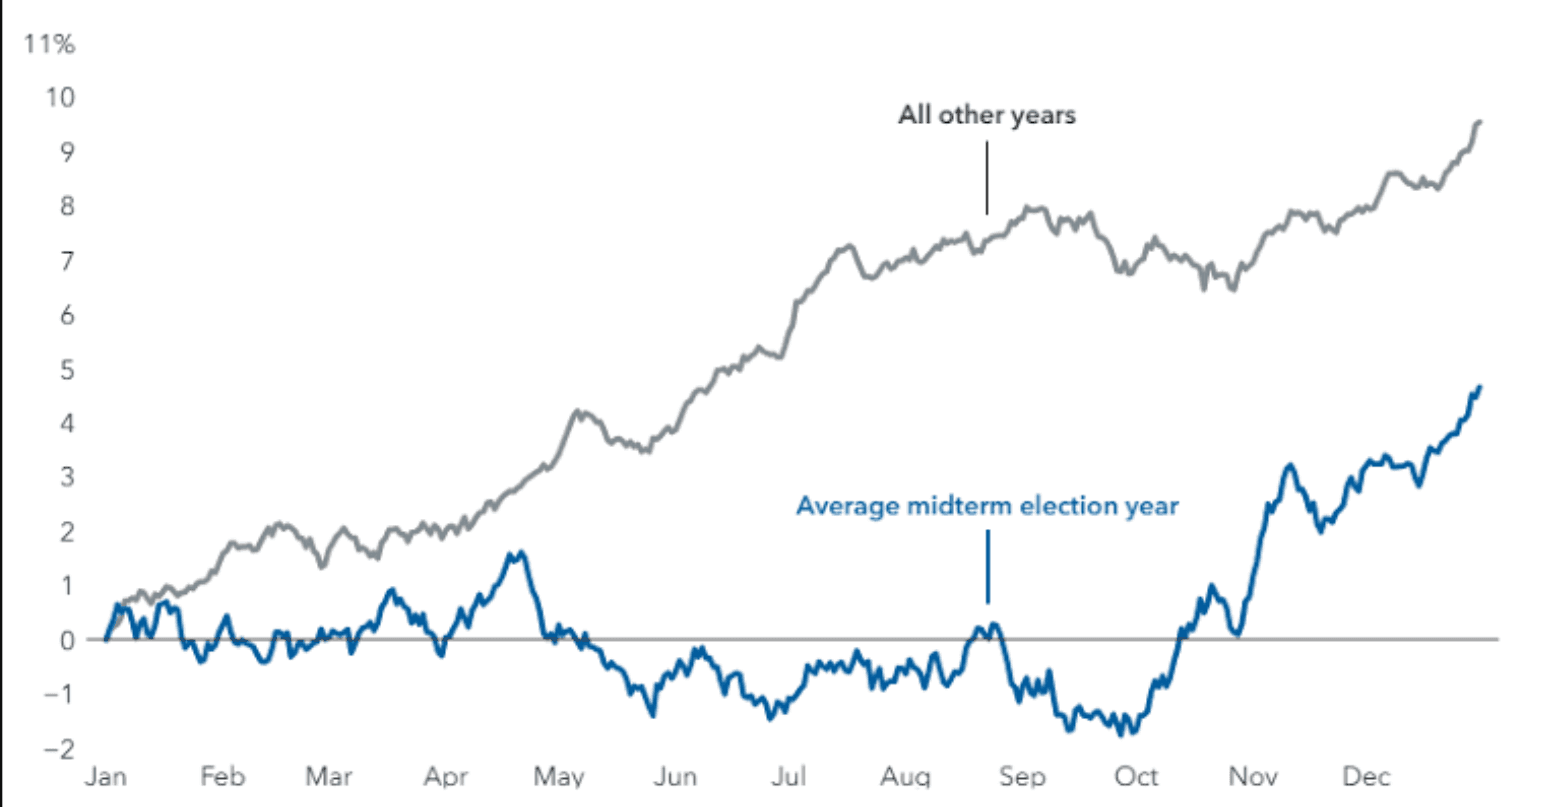
The midterm election stock market effect refers to the historically elevated volatility and above-average drawdowns that have appeared in the back half of midterm election years, typically clustering between August and October. For advisors managing client portfolios through election cycles, understanding this pattern isn't about predicting outcomes — it's about recognizing a well-documented seasonal tendency that shows up across decades of market data, independent of who wins.
This isn't a fringe theory. The pattern is consistent enough that it's become a recognizable feature of the broader presidential election cycle stock market framework that market historians and quantitative researchers have studied for decades.
The Historical Pattern: Midterm Years and Market Drawdowns
Looking back across multiple midterm cycles, a consistent — though not universal — drawdown window emerges in the S&P 500:
2002: roughly a 20% decline between late August and early October
2010: a shallower pullback, with no major correction that cycle
2014: approximately a 10% pullback between mid-September and mid-October
2018: roughly an 11.5% decline from late September into late October
2022: close to a 14% drawdown between mid-August and mid-October
View historical S&P 500 index data on FRED for the full time series behind these figures.
Presidential Election Cycle Stock Market Trends
These midterm-year corrections sit inside a longer four-year rhythm. Research going back decades has generally found that the year following a midterm election — the pre-presidential-election year — tends to be the strongest of the four-year cycle. That doesn't make midterm-year weakness a rule, but it does mean advisors should treat the midterm election stock market effect as one phase within a broader cycle, not an isolated event.
Why Volatility Clusters in Midterm Years
No single explanation fully accounts for the pattern, but several recurring drivers show up in the research:
Policy uncertainty — markets tend to discount ambiguity around potential shifts in fiscal, trade, or regulatory policy ahead of a vote.
Reduced legislative activity — Congress historically slows in the months before an election, which can weigh on policy-sensitive sectors.
Positioning and sentiment shifts — institutional flows often rotate defensively ahead of a known uncertainty event, amplifying short-term moves.
Stock Market Seasonality Patterns Behind the Effect
The midterm effect is best understood as one input among several stock market seasonality patterns, alongside other well-studied calendar effects — including the Santa Claus Rally, another recurring pattern worth building into year-round positioning. None are reliable enough to trade in isolation, but together they inform how advisors approach risk positioning during specific calendar windows.
Historical Stock Market Performance in Midterm Years
Reviewing historical stock market performance in midterm years alongside non-midterm years shows a meaningfully wider dispersion of outcomes in the August-through-October window. That doesn't mean every midterm year produces a correction — 2010 didn't — but the frequency and depth of pullbacks during this window has run higher than the broader average, which is why it warrants attention in portfolio construction conversations, even without forecasting a specific outcome for this cycle.
The Behavioral Trap: Reacting vs. Responding
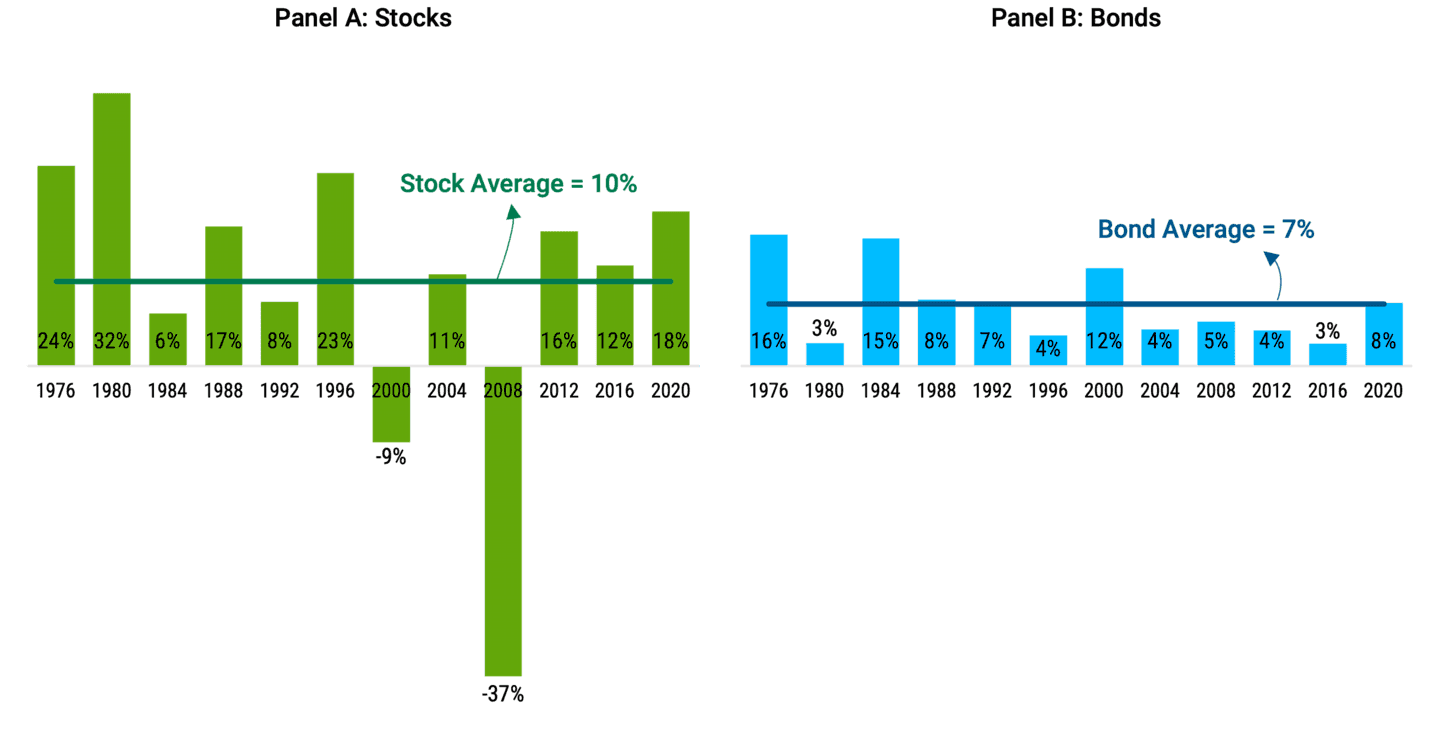
The more dangerous pattern isn't the seasonal drawdown itself — it's how investors respond to it. Landmark research, including William Sharpe's market timing study published in the Financial Analysts Journal, has found that a market timer needs to be right on both the exit and the re-entry to consistently beat a passive benchmark, a bar most investors — and even professional managers — fail to clear over time.
Behavioral Investing Mistakes During Volatile Periods
Common behavioral investing mistakes — including the recency bias that leads clients to overweight recent headlines — tend to intensify during election-year volatility:
Moving to cash based on headlines rather than portfolio-level risk metrics
Abandoning a rebalancing schedule under short-term stress
Re-entering the market only after most of the recovery has already occurred
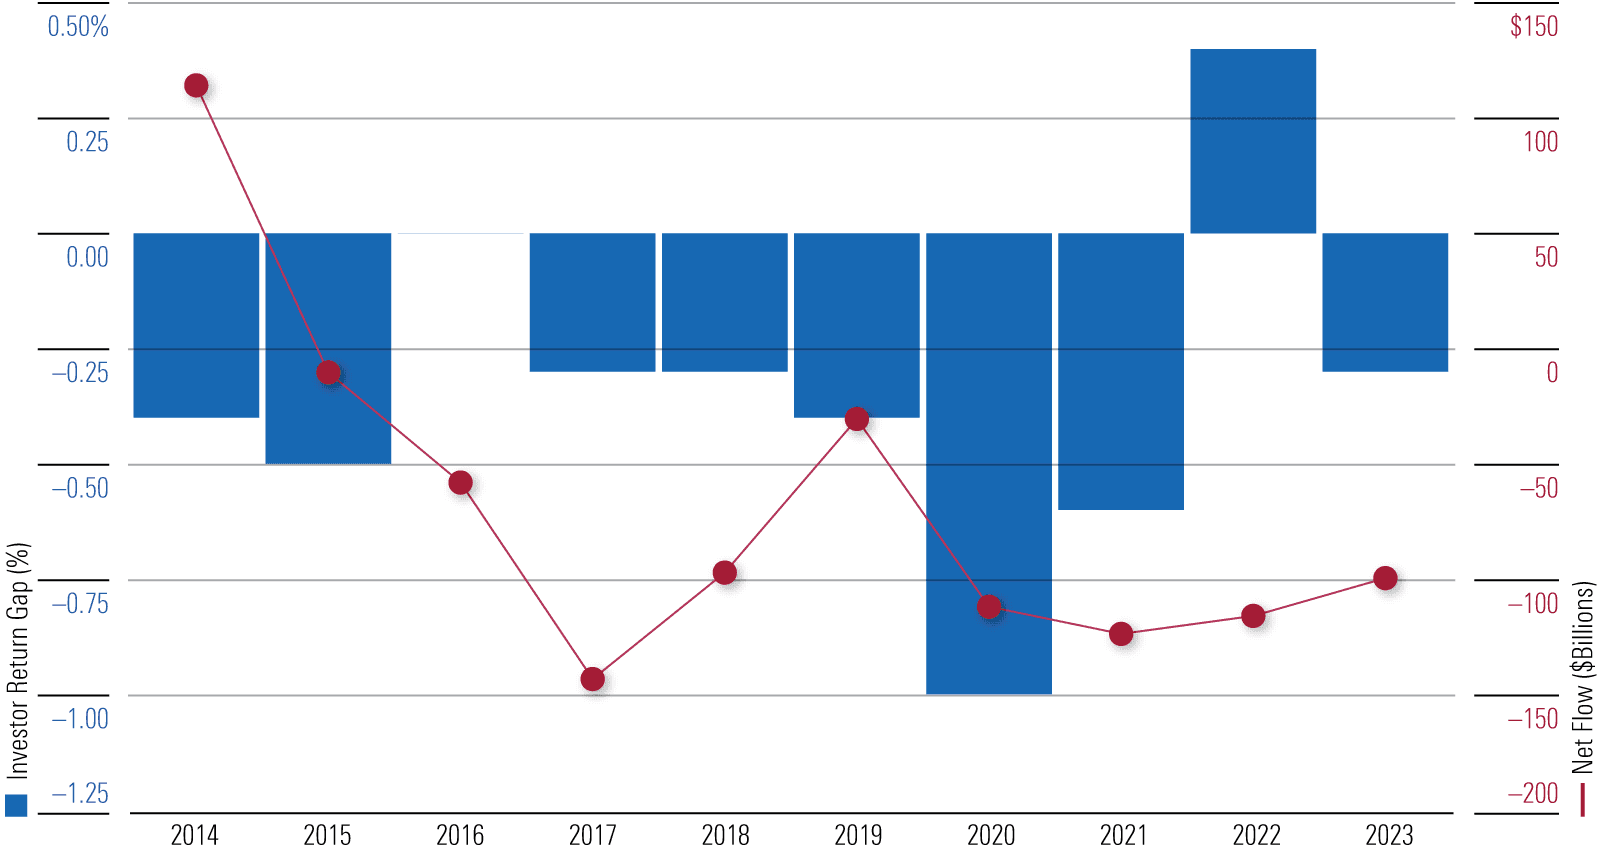
Morningstar's "Mind the Gap" research consistently shows that these reactive decisions — not the market moves themselves — are what erode long-term returns.
A Systematic Approach to Election-Year Volatility
This is where process matters more than prediction. As we've covered in why rebalancing matters more than market forecasts, rather than trying to time the midterm election stock market effect, many advisors build it into a broader systematic investing strategy — one where adjustments are pre-defined rather than improvised mid-drawdown.
Two frameworks are especially relevant here:
Rules-based portfolio rebalancing: adjusting allocations at pre-set thresholds (e.g., a 5% deviation from target weight) rather than reacting to headlines — the same logic behind systematic sell signals advisors use to remove discretion from exit decisions
Portfolio volatility management: using volatility-based triggers, rather than calendar guesses, to scale equity exposure up or down
Layering in a documented drawdown risk management framework — pre-committing to specific responses at specific loss thresholds — removes the guesswork that turns a normal seasonal pattern into a behavioral misstep.
Conclusion
The midterm election stock market effect is a real, historically observable pattern — but it isn't a forecasting tool, and it isn't a reason to abandon a portfolio strategy in favor of a guess. For advisors, the value lies in preparing clients for the possibility of volatility in this window and having a process ready in advance, rather than reacting in real time.
Automate the Process, Not the Guesswork
Recognizing the midterm election stock market effect is one thing. Building a portfolio process that responds to it systematically — without emotional whipsaws — is another. That's exactly the gap Surmount Wealth is built to close.
Surmount gives RIAs and portfolio managers the infrastructure to automate rules-based strategies directly on top of existing brokerage accounts — no fund transfers, and no need to code a system from scratch. Whether you're implementing a volatility-based rebalancing framework, a drawdown-triggered de-risking rule, or a fully custom thesis, Surmount executes it consistently, every time, without the behavioral drag that erodes returns during volatile stretches.
What this looks like in practice:
Prebuilt strategy library — access professional-grade, rules-based strategies ready to deploy, or use them as a starting framework for your own thesis
Fully custom strategy builder — translate any systematic idea, including a seasonal or election-cycle framework, into an automated, rules-based process
No manual rebalancing required — once a strategy is live, allocation adjustments trigger automatically based on your defined rules, not headlines
Runs on your existing brokerage account — no asset transfers, no new custodian relationships, no disruption to how you already operate
Built for advisors managing real client risk — designed around the operational and compliance realities of professional portfolio management, not retail-style trading apps
A Hypothetical Illustration: The Cycle-Aware Rebalancing Monitor
The following is a hypothetical, illustrative concept only — it does not represent an actual Surmount strategy, a recommendation, or any real or backtested performance. It is intended solely to demonstrate the type of thesis that can be automated on the platform.
A strategy like this might monitor portfolio-level volatility and drawdown thresholds through historically higher-risk seasonal windows — such as the months surrounding a midterm election — and automatically shift equity exposure toward a pre-defined defensive allocation when those thresholds are triggered, then systematically restore target weights once volatility normalizes. The point isn't to predict the market — it's to pre-commit to a response, so the decision is made in advance, not in the moment.
This is the kind of thesis Surmount is built to automate — turning a documented process into a system that executes without hesitation, second-guessing, or emotion.
If you're ready to see how a rules-based framework like this could run inside your own client accounts, book a demo with Surmount Wealth today.
FAQ: Midterm Election Stock Market Effect
What causes the midterm election effect?
Policy uncertainty, slower legislative activity, and defensive positioning ahead of the vote tend to drive the midterm election stock market effect each cycle.
When do midterm year drawdowns happen?
Historically, drawdowns have clustered between August and October, based on historical stock market performance in midterm years since 2002.
Does the midterm effect happen every cycle?
No — 2010 saw no major correction, showing the pattern reflects elevated probability, not a guaranteed outcome each cycle.
Why does market timing usually fail?
Research shows a timer must be right on both exit and re-entry, a bar most active management approaches fail to consistently clear.
How can advisors prepare for this pattern?
Rules-based portfolio rebalancing and drawdown risk management frameworks let advisors respond systematically, without relying on market predictions.


