
Blog

IPO Cycle and Market Timing: What History Tells Us
When equity issuance surges, markets tend to follow with pain. That is not a pundit’s instinct — it is one of the more durable findings in academic finance. For portfolio managers navigating a record IPO pipeline alongside historically elevated valuations, understanding the relationship between the IPO cycle and market timing has rarely been more practically relevant.
This post walks through what the academic and historical record actually shows, why the current setup deserves serious attention, and how systematic portfolio management can help advisors act on the signal before the cycle turns.
What the IPO Cycle Actually Measures
The IPO cycle is more than a pipeline of new listings. It reflects the aggregate willingness of insiders, founders, and early investors to convert private equity into public float. That decision is rarely made blindly. When issuance accelerates, it is often because those closest to the companies involved believe current market prices are favorable for the seller — which is not necessarily the same as being favorable for the buyer.
Equity Issuance as a Percentage of Total Capital Raises
Economists track equity issuance not just in raw dollar terms but as a share of total new capital raised — equity plus debt. When that share rises sharply, it signals that companies are preferring to dilute existing shareholders rather than borrow. This is not typically a sign that debt is unavailable. It is more often a sign that equity prices are high enough to make dilution attractive. The distinction matters when interpreting what rising gross IPO proceeds actually tell us about market conditions.
The Baker-Wurgler Finding and What It Implies
The most rigorous academic treatment of this dynamic comes from Malcolm Baker and Jeffrey Wurgler, published in the Journal of Finance in 2002, using data stretching back to 1928. Their core finding: the equity share of total new issuance is a statistically significant predictor of subsequent stock market returns. Specifically, high equity issuance relative to debt issuance precedes periods of below-average market returns. The interpretation is direct. Corporate managers and insiders time the market reasonably well — they issue stock when prices are elevated and when buyers are most willing to pay.
For professional investors, this has a practical implication: a surge in equity issuance is not merely an event to track. It is a valuation signal embedded in the behavior of the most informed market participants.
Historical IPO Cycles and Market Timing Evidence
The theoretical case for treating the IPO cycle and market timing as linked phenomena is reinforced by the two clearest historical examples from recent decades. Both share a common structure: a surge in voluntary equity supply met a market trading near peak valuations, and significant drawdowns followed.
The Dot-Com Peak and the 2021 SPAC Boom Compared
In 2000, equity issuance accelerated into the March peak of the dot-com boom. The S&P 500 subsequently declined roughly 49% to its October 2002 low, while the Nasdaq lost approximately 78% of its value. Twenty years later, the 2020–2021 cycle produced an even larger raw dollar surge, driven by more than 600 SPAC listings and a record IPO calendar. The S&P peaked in early January 2022 and fell approximately 25% over the following nine months.
In both cycles, the newly issued paper underperformed the broader index by a wide margin. The buyers of supply at the top paid the steepest price. The SPAC class that merged between mid-2020 and the end of 2021 had fallen more than 60% from reference price by late 2022. This pattern is consistent with the Baker-Wurgler framework: elevated issuance signals that insiders believe prices are high, not that the businesses being listed lack merit.
Why 2008 Is a False Positive in the Data
A thorough analysis of the IPO cycle and market timing must address one apparent exception: 2008 shows up as a large issuance spike in the long-run data, sitting in the middle of the worst economic contraction since the Great Depression. This is not a counterexample to the signal. It is a category error.
The 2008 issuance surge was not voluntary. It was emergency capital raising by financial institutions facing insolvency, much of it government-assisted recapitalization. The market crash caused the issuance; the issuance did not precede the crash. When you strip out this distress-driven outlier, the two genuine euphoric supply cycles — 2000 and 2021 — both preceded significant drawdowns with no credible counterexample remaining.
The Shiller CAPE Valuation Backdrop Today
The IPO cycle signal becomes considerably more consequential when overlaid with prevailing valuations. A heavy issuance calendar against a cheap market is a manageable dynamic — there is room for prices to absorb the supply. A heavy issuance calendar against a richly valued market compresses that margin of safety substantially.
The Shiller CAPE currently sits around 42 — approximately 28% above its long-term historical average and within a few points of the all-time record set at the 2000 peak.
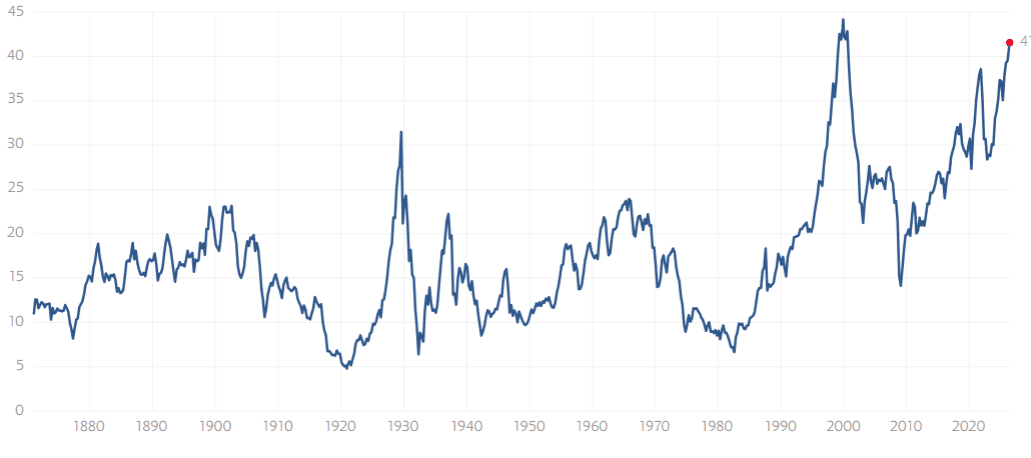
Combined with the rate backdrop we analyzed in our piece on the 30-year Treasury yield in 2026 — where the long end is pricing in persistent inflation and fiscal risk simultaneously — the valuation picture leaves little room for error. As we explored in our analysis of the equity risk premium in 2026, the implied earnings yield on the S&P 500 is barely above the risk-free rate — a condition that leaves almost no cushion when heavy supply arrives.
For a precise definition of the metric itself, the CFA Institute’s treatment of the Shiller CAPE offers the most rigorous institutional framing.
Valuation does not determine timing. Overvalued markets can remain overvalued for extended periods. What Shiller CAPE valuation does determine is the margin for error. At 42x cyclically adjusted earnings, there is very little of it.
Late-Cycle Portfolio Positioning for Advisors
The IPO cycle is a late-cycle marker, not a timing tool. Markets at records can stay irrational longer than most portfolios can stay short. The appropriate response is not aggressive defensiveness but deliberate risk management executed while the tape is still calm. As Bob Farrell’s Rule #4 reminds us, exponential markets tend to run further than anyone expects before they break. The discipline is in acting incrementally, not reactively.
Three adjustments are worth considering when the IPO cycle signals late-cycle conditions. First, raise quality across the portfolio — trim the most speculative exposure and rotate toward businesses with current profitability and pricing power. Second, separate the index from the issue: historical evidence is clear that freshly issued paper underperforms the broader index most severely in the aftermath of issuance surges. Chasing IPO pops has been a losing trade across both the 2000 and 2021 cycles. Third, make adjustments before the catalyst forces them. As we outlined in our guide to recession indicators every portfolio manager should track, systematic risk management consistently outperforms reactive repositioning — and the same principle applies here.
The global liquidity context compounds this further. As we detailed in our analysis of rising bond yields in Asia, the structural liquidity that has supported U.S. equity valuations is under pressure from multiple directions simultaneously.
IPO Lockup Expiration and the Second Supply Wave
One dynamic that receives far less attention than the IPO itself is the lockup expiration wave that follows it. New equity supply hits the market in two stages, not one. First comes the offering. Then, 90 to 180 days later, the lockup expires and insiders, employees, and pre-IPO investors are free to sell. That second supply wave is typically far larger than the offering itself, and it arrives after the headlines have faded and the initial buyers’ attention has moved elsewhere.
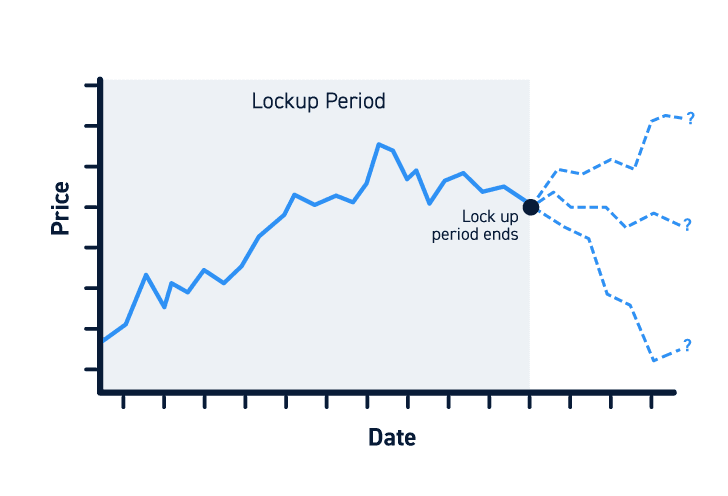
In the current cycle, the IPO lockup expiration overhang projected for 2026 towers over every prior year on record, with combined IPO proceeds and expiring lockup value estimated to push past $700 billion. Academic research on lockup expiration effects consistently documents abnormal negative returns in the window surrounding expiry. For portfolio managers building late-cycle positioning frameworks, monitoring the lockup calendar is as important as tracking the IPO pipeline itself. This is a dimension of S&P 500 concentration risk that index-focused investors frequently underappreciate — particularly those whose portfolios are heavily weighted toward the same mega-cap names dominating the new issuance pipeline.
Automate Your Late-Cycle Strategy With Surmount Wealth
Understanding the IPO cycle and market timing relationship is the analytical work. Acting on it — systematically, without emotion, and before the catalyst forces your hand — is where most advisors lose the edge their research should have delivered.
That is precisely the problem Surmount Wealth is built to solve. Surmount is an AI-driven, automated investing platform that lets portfolio managers and RIAs build, backtest, and deploy rules-based investment strategies directly onto existing brokerage accounts. No fund transfers. No coding from scratch. Just institutional-grade execution infrastructure applied to your best analytical work.
Hypothetical Strategy Illustration — “IPOSurge Rotation Model”
Consider a hypothetical strategy built around the dynamics discussed in this post. The IPOSurge Rotation Model would systematically monitor three inputs: trailing equity issuance as a share of total capital raised, the Shiller CAPE relative to its long-run average, and IPO lockup expiration calendar projections. When all three breach defined thresholds simultaneously — signaling a late-cycle issuance environment against an overvalued backdrop — the strategy automatically rotates out of speculative, high-beta equity exposure and into quality-factor tilts, defensive sectors, and shorter-duration positions. As conditions normalize, it scales back into risk. No discretion. No hesitation. No lag between signal and execution.
This is a hypothetical concept for illustrative purposes only and does not represent an actual deployed strategy or investment advice.
This is exactly the kind of thesis-driven automation Surmount makes possible. Why Surmount Wealth:
Deploy prebuilt strategies instantly — choose from a growing library of professionally designed automated strategies covering macro, factor, and thematic themes
Build fully custom strategies — encode any investment thesis, including late-cycle IPO cycle signals, into a rules-based model without writing a single line of code
No fund transfers required — strategies run directly on your existing brokerage account infrastructure
Backtest before you deploy — validate any strategy against historical data before committing capital
Systematic rebalancing on autopilot — execution triggers are automated, eliminating the hesitation gap between signal and action
Your macro analysis deserves better than a research note that sits idle. Book a demo with Surmount Wealth today and see how your highest-conviction late-cycle thesis can run on autopilot.
➤ Book a Demo with Surmount Wealth
Conclusion
The relationship between the IPO cycle and market timing is not a matter of folklore. It is grounded in decades of academic research, confirmed by the two most significant equity issuance surges of the modern era, and more relevant today than at any point since the dot-com peak. The supply is coming. Shiller CAPE valuations leave little margin for error. The IPO lockup expiration wave will add a second layer of supply after the headlines have moved on.
None of this guarantees an imminent correction. Markets can stay expensive longer than the data would suggest is rational. What it does demand is that portfolio managers build late-cycle discipline into their process now — not after the catalyst has arrived. The advisors best positioned will be those who act on the signal systematically, not reactively, and whose portfolios reflect that discipline before the music stops.
FAQ: IPO Cycle and Market Timing
What does the IPO cycle predict about markets?
A surge in equity issuance relative to debt issuance historically precedes below-average stock market returns. Academic research using data back to 1928 shows that corporate insiders tend to issue stock when prices are elevated, making the IPO cycle a reliable late-cycle signal.
How does market timing relate to IPO volume?
High IPO volume typically coincides with peak valuations and investor optimism, creating conditions where newly issued paper is most vulnerable to subsequent derating. The 2000 and 2021 cycles both confirm this pattern: the IPO class underperformed the broader index severely in the aftermath.
What is IPO lockup expiration risk?
Lockup expiration is the period — typically 90–180 days post-IPO — when insiders and pre-IPO investors are first permitted to sell. This second supply wave is usually larger than the IPO itself and arrives after investor attention has faded, creating concentrated selling pressure on newly listed names.
What is the Shiller CAPE and why does it matter?
The Shiller CAPE smooths earnings over a 10-year period to remove cyclical distortions. At current levels near 42, it signals the second-most-expensive U.S. equity market on record, reducing the margin of safety available to absorb a heavy issuance cycle.
How should advisors position for late-cycle IPO risk?
Late-cycle portfolio positioning involves raising quality, trimming speculative exposure, and avoiding newly issued paper near IPO pricing. Systematic, rules-based rebalancing ensures these adjustments happen proactively, before market conditions force reactive repositioning at worse prices.


